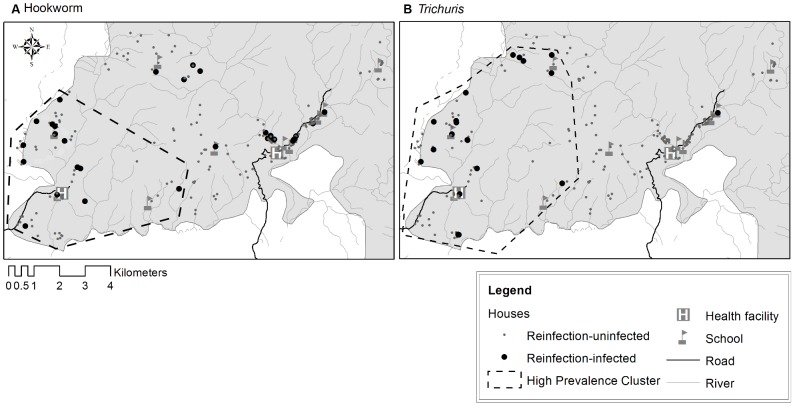
Figure 2. Spatial clusters of households with high prevalence of hookworm and Trichuris infection.
High prevalence clusters (dotted line) for hookworm (A) and Trichuris (B) infection detected at Baseline of Cycle 2. Uninfected (small grey dots) and infected households (large dark dots) based on data from Cycle 2 at 6 mo (hookworm and Trichuris).

