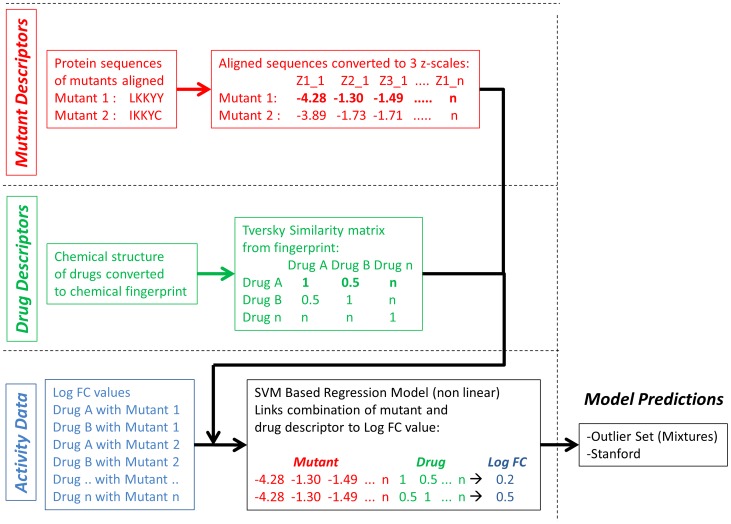
Figure 1. Flowchart of the work performed here.
A distinction is made between the preparation of mutant descriptors (shown in red), drug descriptors (shown in green) and activity data (Log FC, shown in blue). The descriptors and Log FC values are combined, and subsequently a model is created using a non-linear modeling technique (support vector machines, SVM). The final step is model validation (shown in black) which is done both on the outlier set by van der Borght et al. and the independent Stanford university set.

