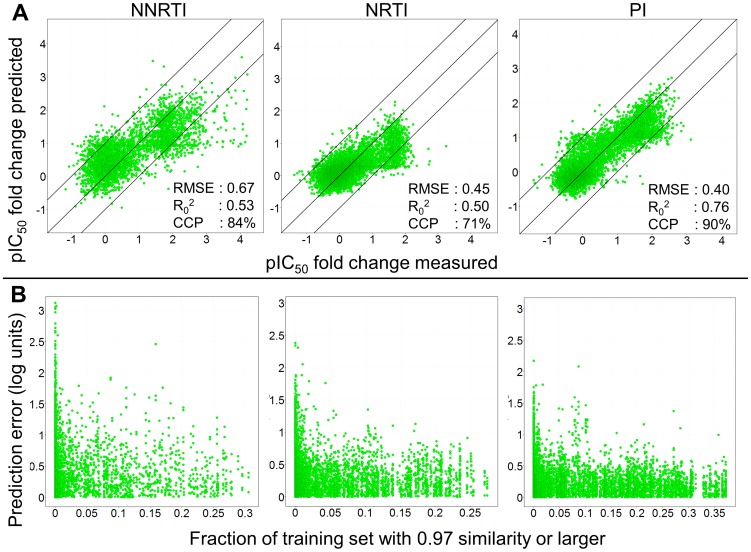
Figure 3. The model performance in the LOSO experiments.
(A) The figure visualizes the measured Log FC for a mutant – drug pair on the x-axis. The y-axis shows the Log FC predicted for that mutant – drug pair by a model that was trained without that particular pair. Again the PIs perform the best (RMSE 0.40 log units, R0 2 0.76, and CCP 90%) followed by the NNRTIs (RMSE 0.67 log units, R0 2 0.53 and CCP 84%) and then the NRTIs (RMSE 0.45 log units, R0 2 0.50 and CCP 74%). (B) The density to the training set as a measure of applicability domain provides a useful estimate to predict model reliability. The x-axis shows fraction of the training set that has a similarity of 0.97 or higher to a specific mutant – drug pair. If this fraction is larger, then the prediction error (y-axis) for that pair becomes smaller as the model is better able to extrapolate from the training set. Since this fraction can be calculated before any model prediction is made, a maximally allowed prediction error can be predetermined before any model predictions are made.

