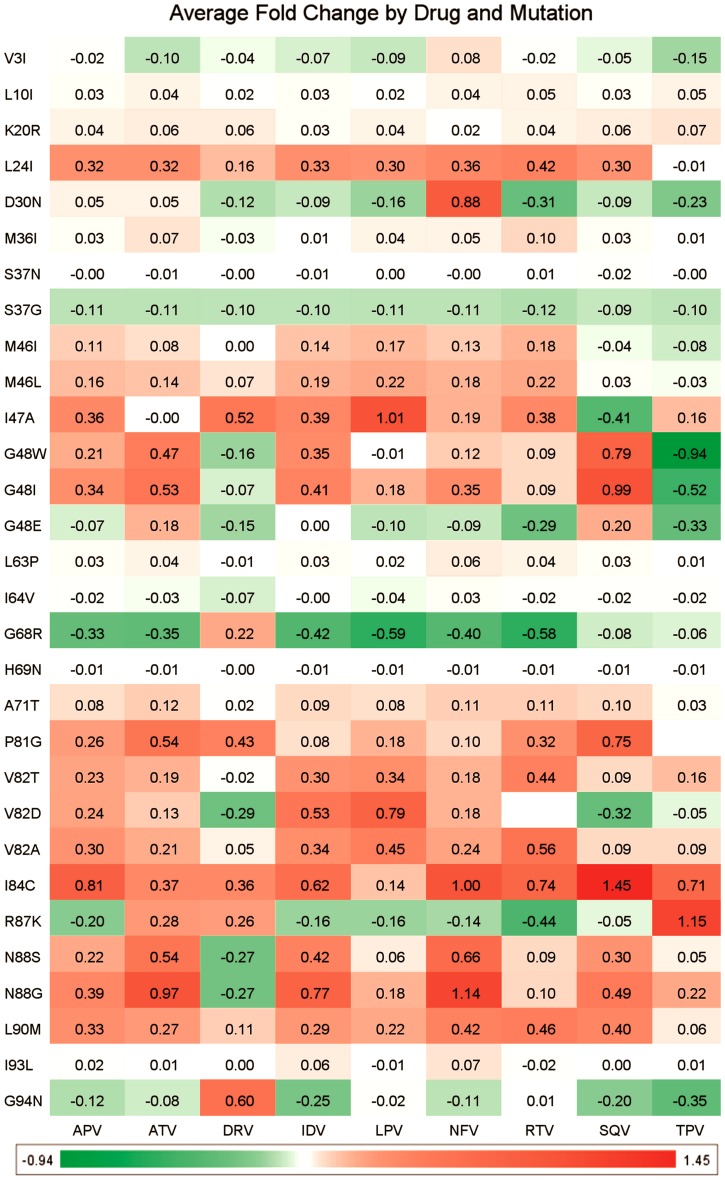
Figure 6. Model interpretation, mutations leading to PI specific resistance.
Shown are the 30 mutations that have the most diverse effect over the different members of the PI drug class. The figure contains a number of known mutations (e.g. M46L, [6] A71T, [6] V82A, [6] V82S [6]) but also several novel mutations (e.g. G48W, N88G). Values in the cells represent Log FC.

