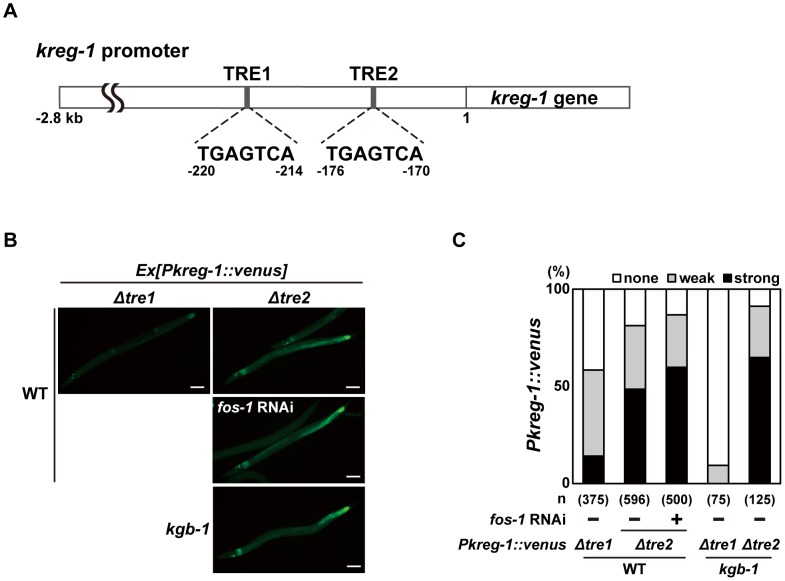
Figure 5. FOS-1 negatively regulates kreg-1 expression via the TRE2 site.
(A) Schematic representation of the structure of the kreg-1 promoter. Two TRE sites are represented by dark boxes. (B, C) Effect of deletion of the TRE sites on expression of the kreg-1 reporter. Wild-type and kgb-1 mutant animals harboring the Pkreg-1Δtre1::venus or Pkreg-1Δtre2::venus transgene as an extrachromosomal array were cultured on plates seeded with a bacteria strain expressing the double-stranded RNA for fos-1. Fluorescent (Venus) views are shown in B. Scale bar: 100 µm. “Weak” refers to animals in which intestinal Venus was present at low levels. “Strong” indicates that Venus was present at high levels in most of the intestine. Percentages of animals in each expression category are listed in C. The numbers (n) of animals examined are shown.

