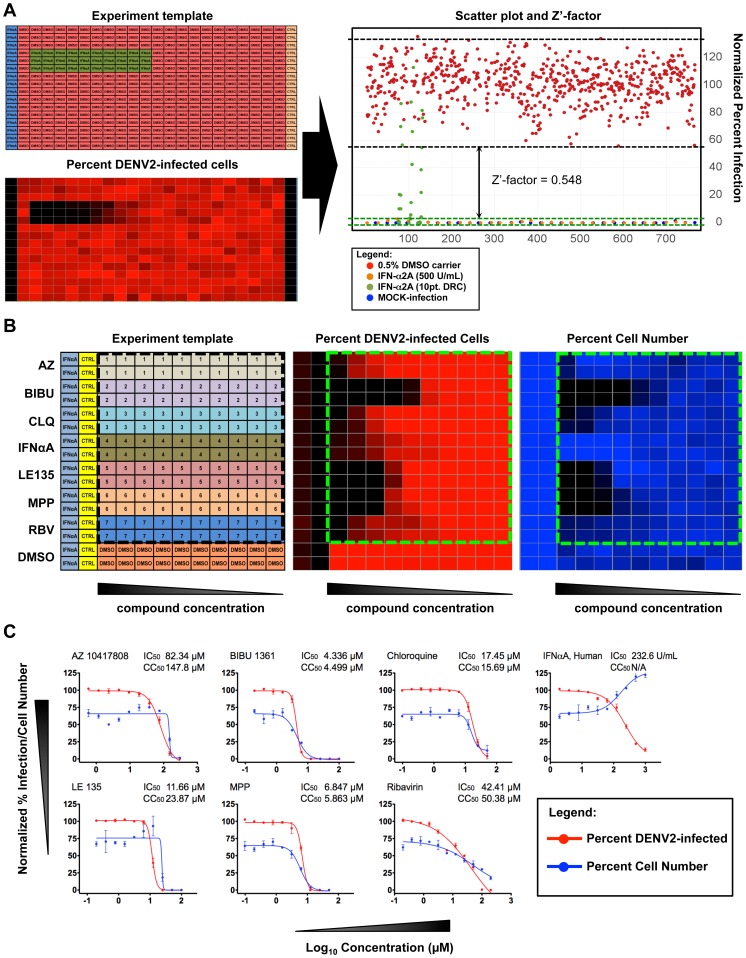
Figure 2. Assay validation of the image-based dengue HT/HCA.
The first assay validation determined the degree of separation between positive and negative controls (A). Upper left panel: layout of controls in the 384-well plate; Lower left panel: generated heat-map representing percentage of Huh-7.5 infected with DENV2; Right panel: Scatter plot distribution shows the percentage of DENV2-infected cells under the following treatments: 0.5% DMSO carrier (red), 500 U/mL IFN-α2A (orange), 10 pt. DRC of IFN-α2A (green), MOCK-infection (blue). Area under the black and green dotted lines represents the variability of DENV infection and MOCK infection controls, respectively. The arrows represent the degree of separation (Z'-factor) between the two controls. The second assay validation determined the dose-response curves of a reference compound panel (B). Left panel: layout of the reference compounds spotted in designated wells of a 384-well plate; Middle panel: heat-map showing relative percentage of DENV2-infected cells; Right panel: heat-map showing relative percent cell viability based on average cell number. (C) 10 pt. DRC of the reference compound panel. Percent infection was normalized against DENV2-infected Huh-7.5, and percent cell number was normalized against MOCK-infected Huh-7.5.

