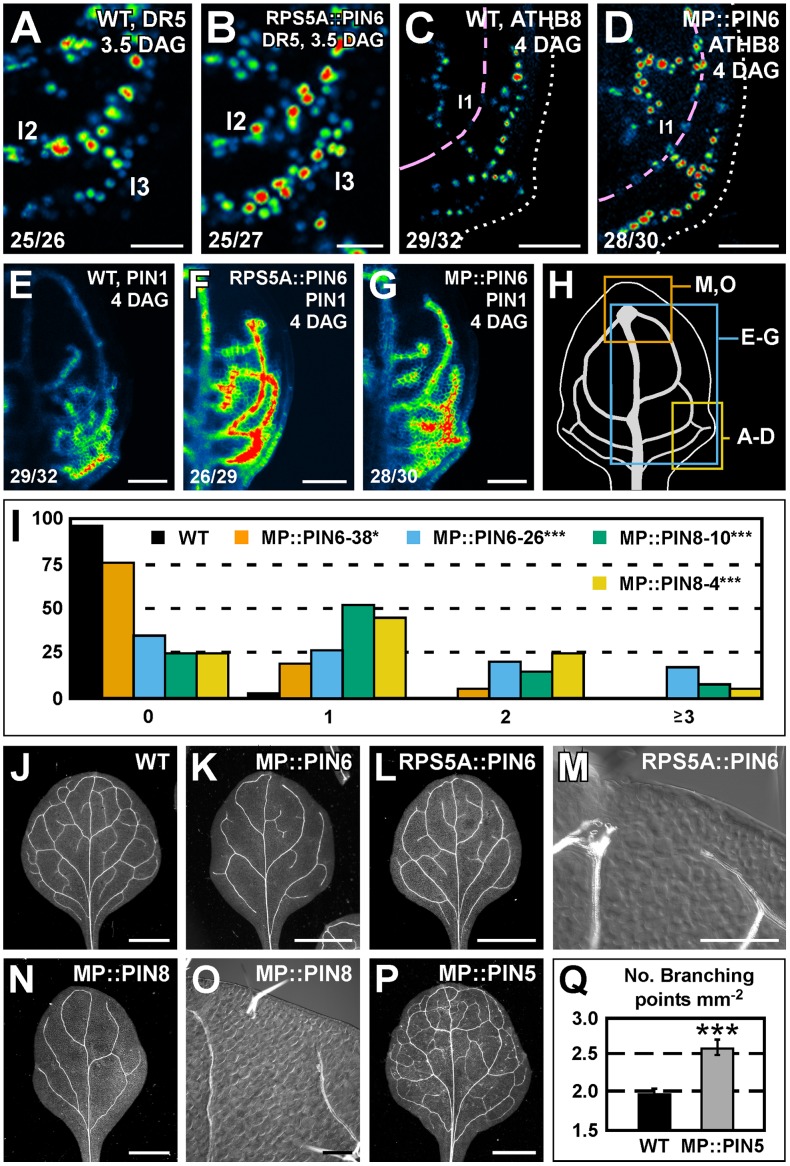
Figure 6. Sufficiency of PIN5, PIN6, and PIN8 for vein network formation.
(A–G,J–P) Top right: genotype, markers and leaf age in days after germination (DAG). Bottom left: reproducibility index. (A–G) Confocal laser scanning microscopy; first leaves. LUT (in Figure 2K) visualizes expression levels. (J–P) Dark-field (J–L,N,P) or differential-interference-contrast (M,O) illumination of cleared mature first leaves. (A,B) DR5rev::YFPnuc expression. (C,D) ATHB8::CFPnuc expression. Magenta line connects nuclei in the first loop (l1). Dotted line: leaf outline. (E–G) PIN1::PIN1:YFP expression. (H) 4-DAG first leaf illustrating positions of close-ups in (A–D), (E–G) and (M,O). (I) Percentage of first leaves with 0, 1, 2 or ≥3 open loops. Difference between MP::PIN6 and WT, and between MP::PIN8 and WT was significant at P<0.05 (*) or P<0.001 (***) by Kruskal-Wallis and Mann-Whitney test with Bonferroni correction. Sample population sizes: WT, 43; MP::PIN6-38, 40; MP::PIN6-26, 42; MP::PIN8-10, 40; MP::PIN8-4, 40. (Q) Vein network complexity as mean ± SE number of vein branching points per first-leaf area unit in mm2 [28]. Difference between MP::PIN5 and WT was significant at P<0.001 (***) by unpaired, two-tailed t-test. Sample population sizes: WT, 28; MP::PIN5, 28. l1, first loop; l2, second loop; l3, third loop. Bars: (A,B) 25 µm; (C–G) 50 µm; (J–L,N,P) 1.5 mm; (M,O) 0.2 mm.

