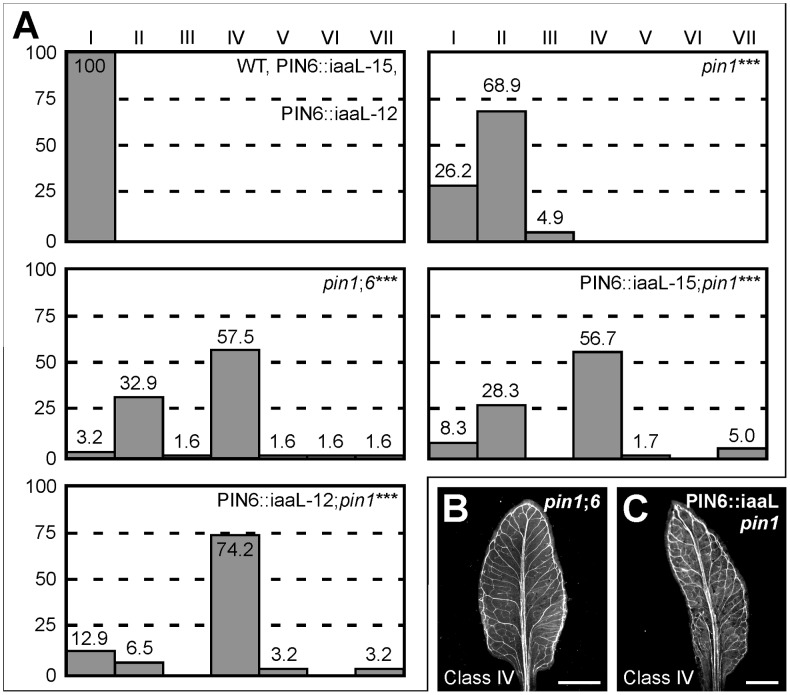
Figure 7. Control of PIN1-dependent vein patterning by intracellular auxin levels.
(A) Percentages of leaves in phenotype classes (defined in Figure 1). Difference between pin1 and WT, between pin1;6 and pin1, and between PIN6::iaaL;pin1 and pin1 was significant at P<0.001 (***) by Kruskal-Wallis and Mann-Whitney test with Bonferroni correction. Sample population sizes: WT, 50; PIN6::iaaL-15, 50; PIN6::iaaL-12, 50; pin1, 61; pin1;6, 61; PIN6::iaaL-15;pin1, 60; PIN6::iaaL-12;pin1, 62. (B,C) Dark-field illumination of cleared mature first leaves. Top right: genotype. Bottom left: phenotype class. Bars: (B,C) 2 mm.

