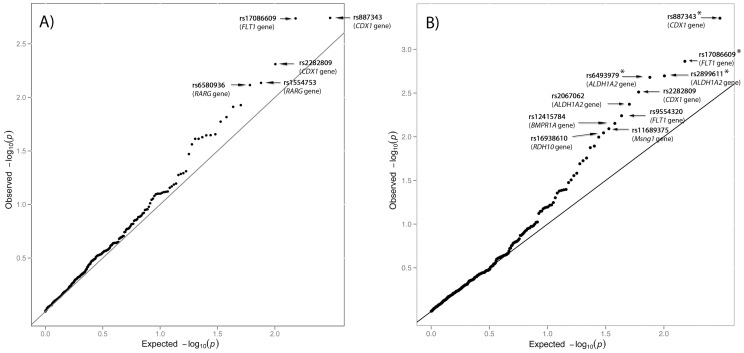
Figure 2. Quantile-quantile plot of the 303 P-values obtained in the association study under the additive model.
404 CMI patients versus 519 controls (A), and 186 small-PCF CMI versus 519 controls (B). SNPs with P-value<0.01 are indicated. Asterisks denote SNPs displaying association after 10% FDR correction for multiple testing (P<2.09E-03).

