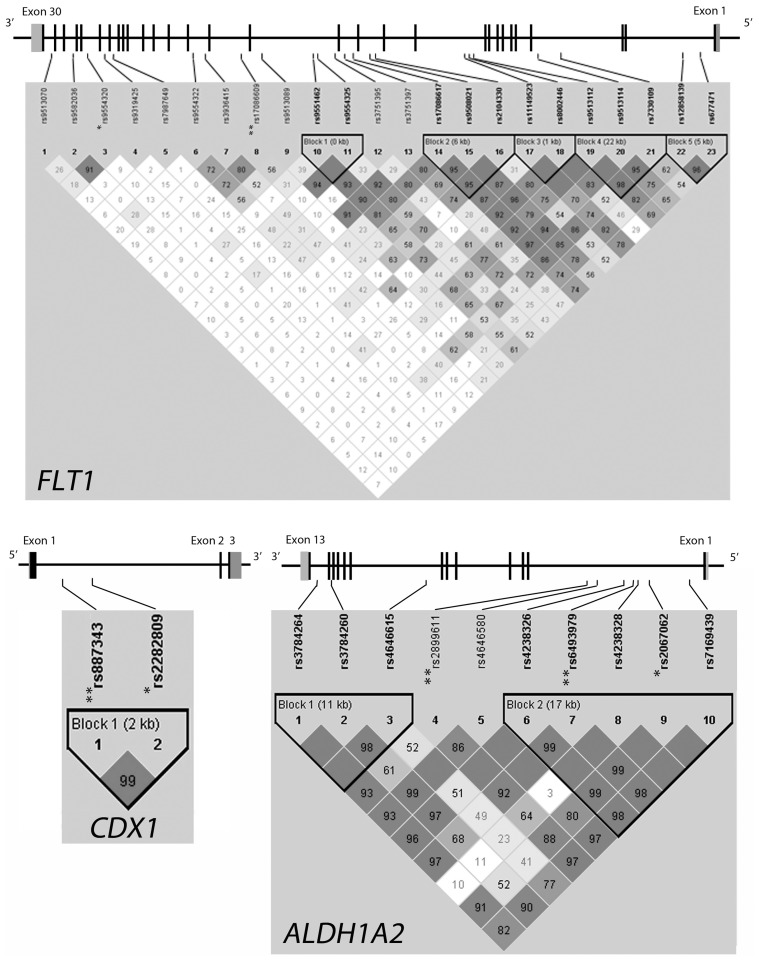
Figure 3. Haploview graphs showing the markers tested and haplotype blocks constructed for ALDH1A2, CDX1 and FLT1.
D′ values are indicated (tones from white to dark grey indicate D′ values from 0 to 1, respectively). The genomic structures of ALDH1A2, CDX1 and FLT1 genes are drawn with coding exons indicated as black boxes. The SNPs with P-value<0.01 are indicated with an asterisk (*); the SNPs showing association after 10% FDR correction for multiple testing (P<2.09E-03) are indicated with a double asterisk (**).

