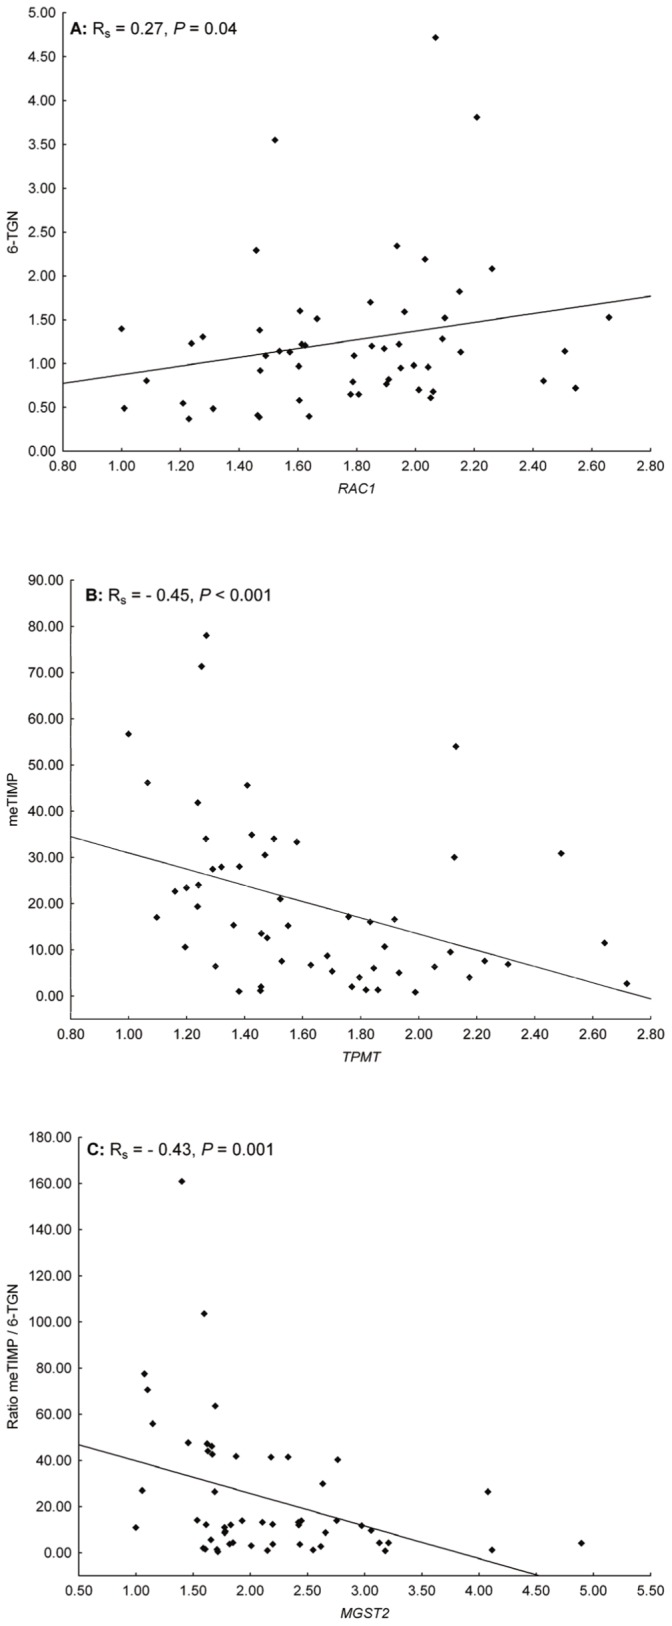
Figure 2. Scatterplots of genes selected for a proven or potential relationship to thiopurines (RT qPCR data).

Scatterplots illustrating the co-variation between the relative gene expression levels of the genes with the most significant correlation coefficients with the concentration of A) 6-TGN, B) meTIMP or C) the meTIMP/6-TGN concentration ratio.
