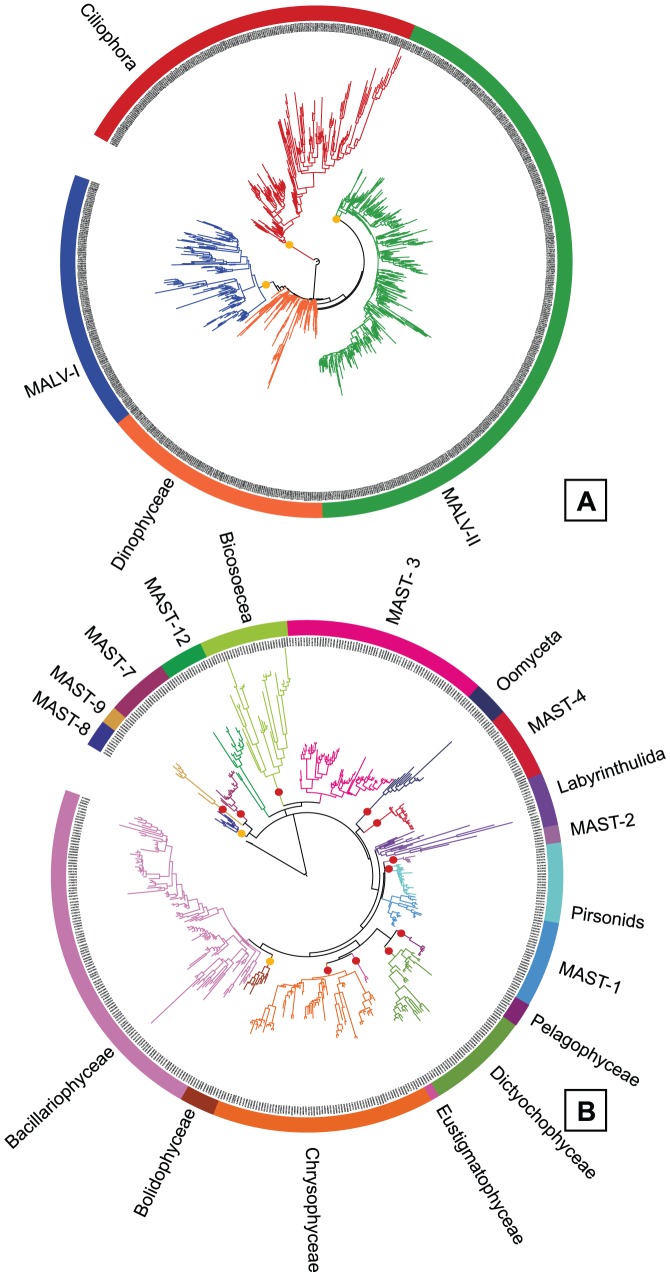
Figure 2. Maximum Likelihood phylogenetic trees for eukaryotic supergroups.
Trees include several taxonomic groups within Alveolata (A), Stramenopiles (B), and are done with sequences representative of each OTU obtained clustering at 0.05 distance (A) and 0.01 distance (B). The number of sequences (about 550 bp in length) per tree is 798 and 523 respectively. Red dots represent bootstrap values above 75 and orange dots values above 50.

