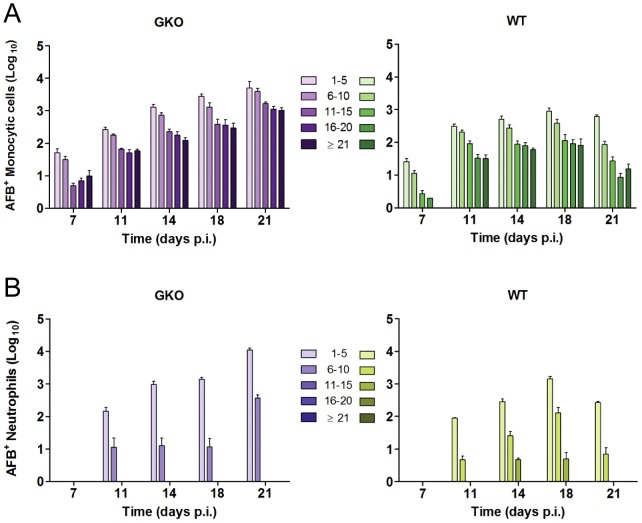
Figure 7. Distribution of AFB loads in lung monocytic cells and neutrophils from WT and GKO mice with TB.
GKO and WT mice were challenged by aerosol with 100 CFU of Mtb Erdman delivered to the lung. BAL was performed 7, 11, 14, 18 and 21 days p.i. A total of 4.8×10⁶ Ziehl-Neelsen stained cells were counted. Numbers of AFB per cell were grouped into 5 bins as indicated and counted separately in monocytic cells (A) and neutrophils (B) from GKO and WT mice. Results are presented as mean log10 AFB+ cells in each bin ± SD. GKO mice had a greater number of AFB+ monocytic cells in all bins at 7 days p.i. and a significantly higher proportion of cells with ≥11 AFB compared to WT mice at that time point. The proportion of cells within each bin was similar between WT and GKO mice on days 11–18 p.i. but by day 21 p.i. the proportion of cells with ≥11 AFB fell significantly in WT compared to GKO mice. On day 21 p.i. the number of AFB+ neutrophils from GKO mice was significantly higher than earlier time points. In contrast, the number of AFB+ neutrophils from WT mice was significantly lower on day 21 than day 18 p.i.

