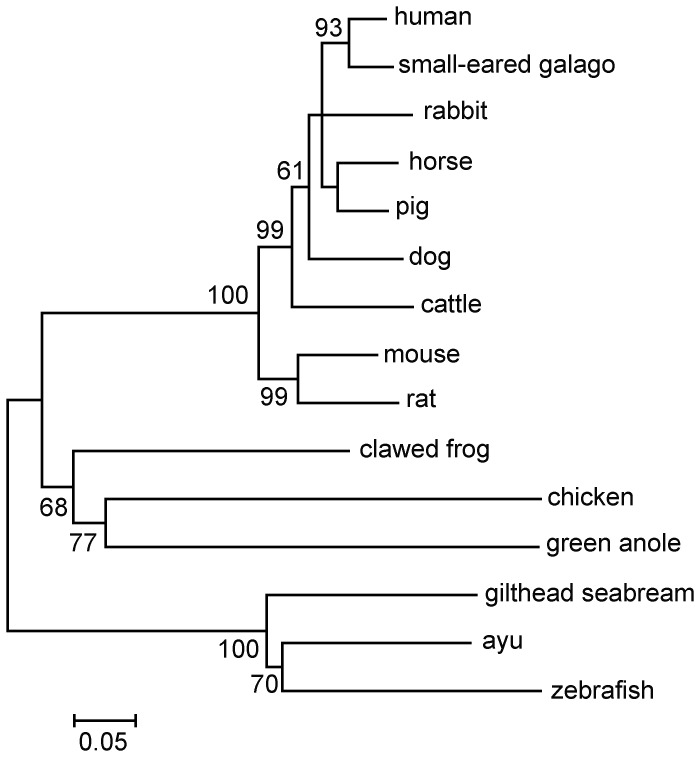
Figure 2. Phylogenetic analysis of aP2X7R amino acid sequences using the neighbor-joining method.
The values at the forks indicate the percentage of trees in which this grouping occurred after bootstrapping (1000 replicates). The scale bar shows the number of substitutions per base. The accession numbers of sequences used are human (H. sapiens), Q99572; small-eared galago (O. garnettii) XM_003795998; dog (C. familiaris), NM_001113456; horse (E. caballus), XM_001495572; pig (S. scrofa), XM_001926804; cattle (B. Taurus), NM_001206516; rabbit (O. cuniculus), XM_002719745; mouse (M. musculus), AJ489297; rat (R. norvegicus), NM_019256; clawed frog (X. laevis), AJ345114; chicken (G. gallus), XM_001235162; green anole (A. carolinensis), XM_003222779; gilthead seabream (S. aurata), AJ887997; ayu (P. altivelis), HE984576; and zebrafish (D. rerio), AY292647.

