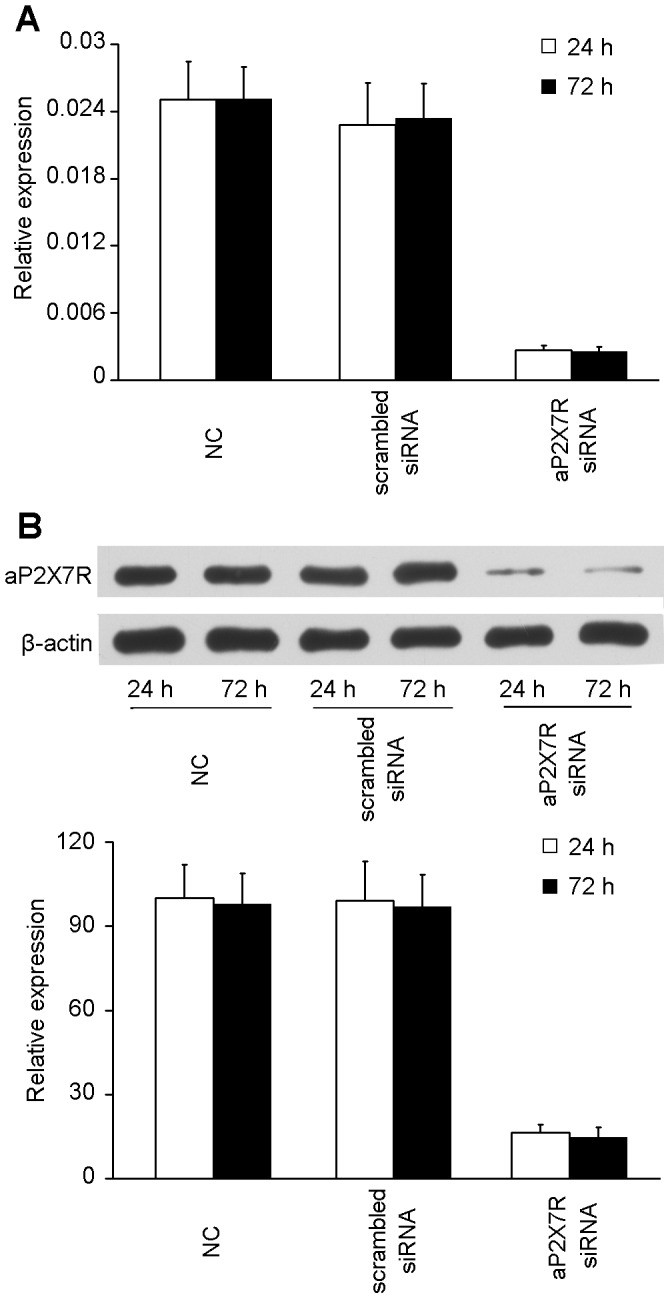
Figure 6. RT-qPCR and Western blot analysis of aP2X7R expression following siRNA transfection.

aP2X7R siRNA was transfected into macrophages for 48 or 72 h. Scrambled siRNA was transfected as a control. (A) Histogram displaying the aP2X7R mRNA expression following siRNA transfection by RT-qPCR analysis. (B) The effects of aP2X7R siRNA transfection on knockdown of aP2X7R protein was confirmed by Western blot analysis. Histogram displays the changes in relative band intensity of aP2X7R protein upon siRNA treatment. Data are representative of three independent experiments. NC: negative control without any siRNA.
