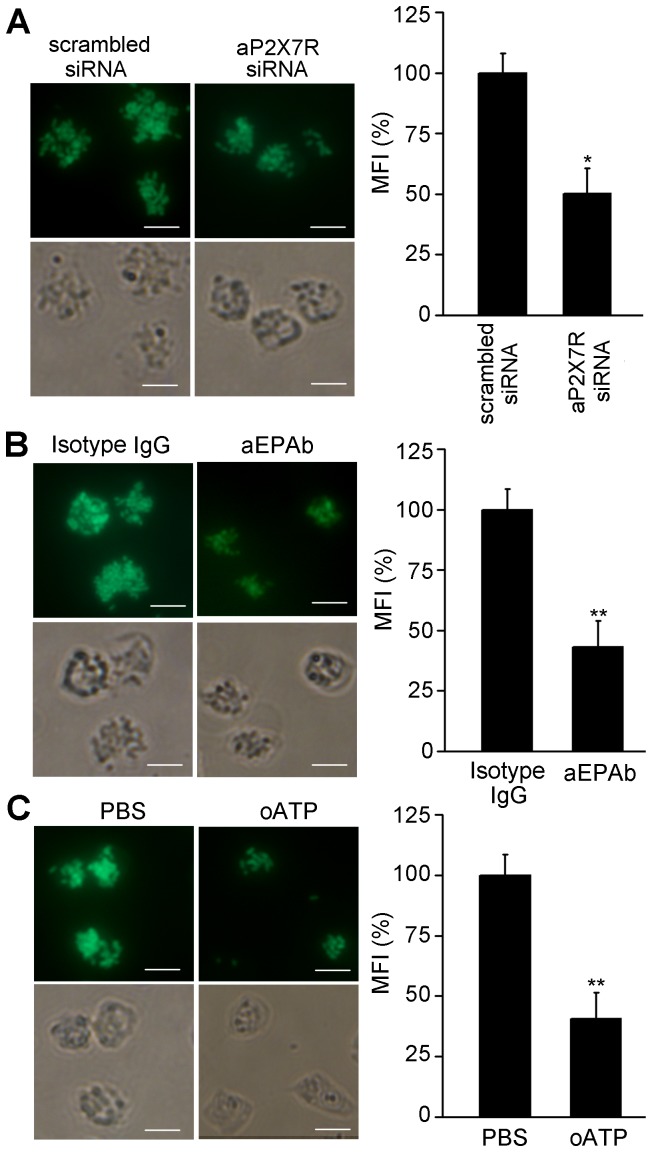
Figure 8. The phagocytosis of ayu macrophages after aP2X7R ablation.
Fluorescence images of phagocytosis of FITC-DH5α in macrophages treated with siRNA (A), aEPAb (B), and oATP (C). After incubation with siRNA for 48 h, aEPAb for 30 min, or oATP for 2 h, macrophages were incubated with FITC-DH5α at an MOI of 10 for an additional 30 min. Scrambled siRNA, mouse isotype IgG, and PBS were added as controls. Histogram represents the percent mean fluorescence intensity (MFI) of bacteria engulfed by cells treated with siRNA, aEPAb, or oATP. Data are representative of at least three independent experiments. Scale bar, 10 µm. *P<0.05; **P<0.01.

