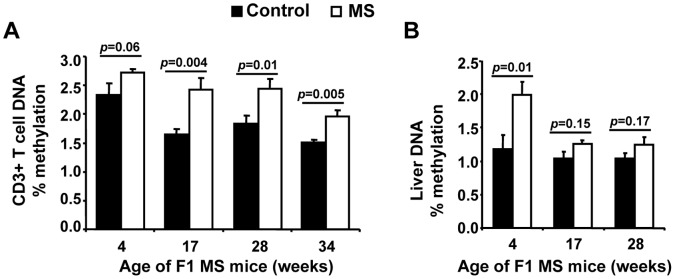
Figure 4. T cells and Liver from MS F1 mice are hypermethylated relative to control mice.

T cell (A) and Liver (B) DNA were isolated from 4 wk, 17 wk, 28 wk or 34 wk old F1 ApoE−/− mice and the level of methylation measured by ELISA. For each age group, the percent of methylated DNA (5-mC) in total DNA are shown. Results are mean ± SEM. (A) 4 wk: N = 5 control, 6 MS mice; 17 wk: 26 control, 23 MS mice; 28 wk: 28 control, 23 MS mice; 34 wk: 9 control, 9 MS mice. (B) 4 wk: N = 5 control, 6 MS mice; 17 wk and 28 wk: 10 control, 10 MS mice.
