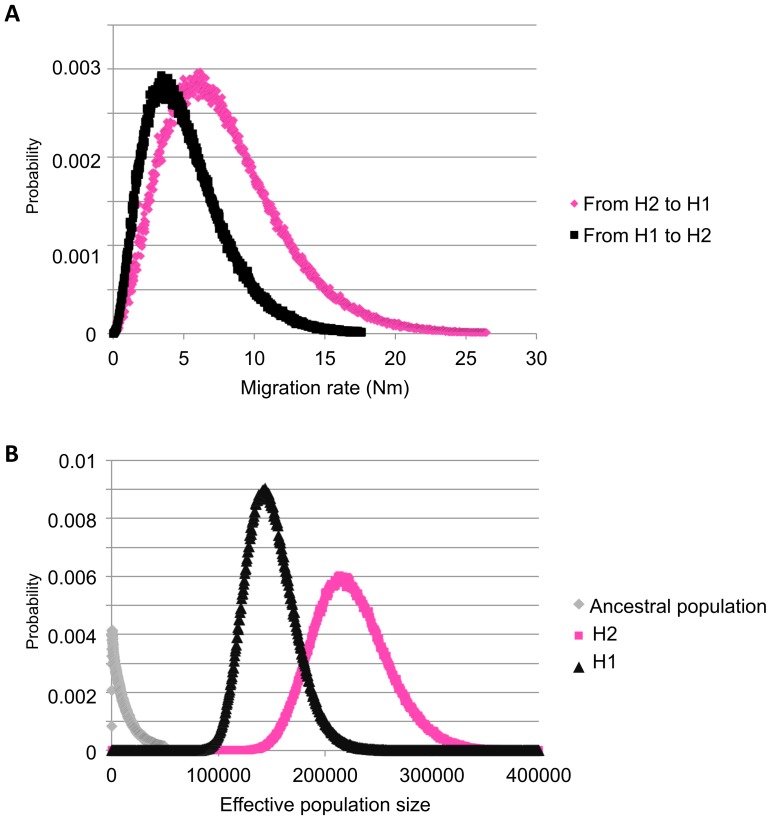
Figure 5. Plots of the posterior probability distribution of parameters estimated from the isolation-with-migration model performed with the IM software.
A Posterior distribution for migration estimates of the directional migration rates from H1 to H2 (in black) and otherwise (in pink); B Posterior distribution of estimates of the population sizes for the ancestral (in grey), H1 (in black) and H2 (in pink) populations.

