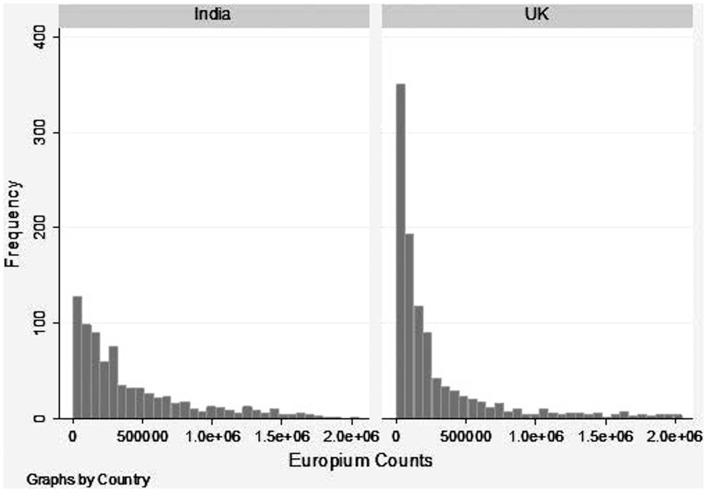
Figure 1. Distribution of Europium counts obtained with sera from the India and UK sera cohorts.
The europium counts were log transformed for a normal distribution. The first plate from India was the reference category and a slope and intercept was calculated for all other plates from both India and the UK. The slope and the intercept values were used to standardize the log-transformed europium counts across experimental runs. Standardized log-transformed values were then used for all analyses.

