
Figure 3. Results and comparison of electrophysiological responses to either cathodal or sham stimulation in the primary motor area.
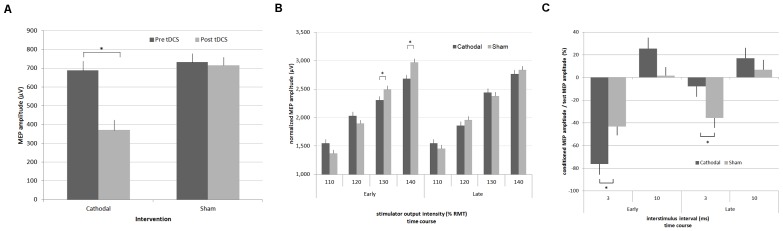
A) Cortical excitability estimates. MEP average amplitude in the early and later period. In contrast to sham tDCS, cathodal tDCS significantly diminished mean MEP amplitudes by about 50%. B) Input-output curves. MEP average amplitudes at 110% through 140% RMT. In contrast to sham tDCS, cathodal tDCS significantly diminished mean MEP amplitudes at stimulation strengths of 130% and 140% RMT. C) Short-interval intracortical inhibition (SICI) and intracortical facilitation (ICF). Average amplitudes of the test MEP at 2 and 5 ms ISI. SICI is enhanced in the early and significantly reduced in the late post-stimulation period after cathodal stimulation. ICF is not significantly affected by the cathodal stimulation. The time periods in all figures correspond to the definition of time intervals in Figure 1. Error bars represent the standard error of the mean. * p<0.05