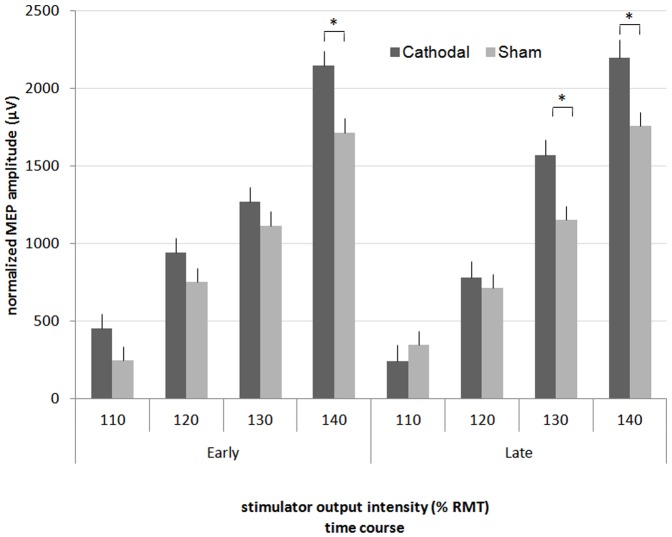
Figure 4. Input-output curves over PMC. MEP average amplitudes defined by stimulation at 110% through 140% RMT.
In contrast to sham tDCS, cathodal tDCS significantly enhanced cortical excitability. Significant results were found at 130% (late period) and 140% (both periods) RMT. Error bars represent the standard error of the mean. * p<0.05

