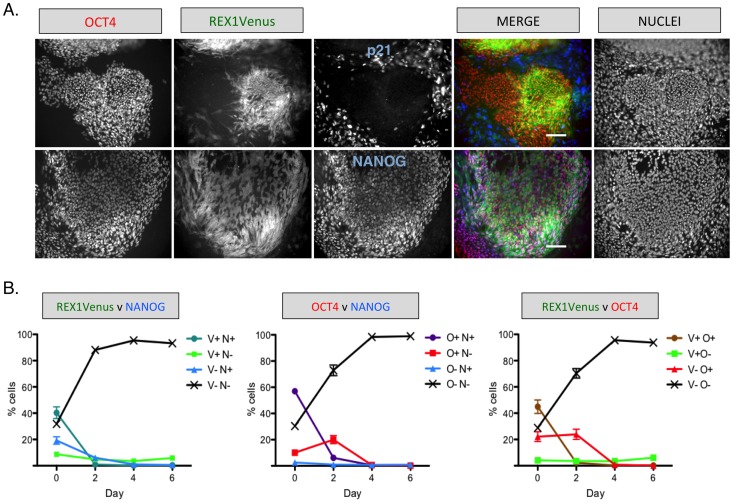
Figure 3. Distribution of pluripotent markers in undifferentiated REX1Ven/w hPSCs.
A) Immunocytochemistry for OCT4 (red), NANOG (blue, bottom row) or p21 (blue, top row) in REX1Ven/w cells. Scale bar = 120 microns. B) Quantification of REX1Venus, OCT4 and NANOG expression by high content imaging and automated cell level analysis in undifferentiated cultures (Day 0) and during a time course of retinoic acid induced differentiation (n = 4). V = REX1Venus, O = OCT4, N = NANOG, + = positive, − = negative.

