
Figure 5. Phenotype of REX1Venus positive and negative populations within REX1Ven/w hESC cultures.
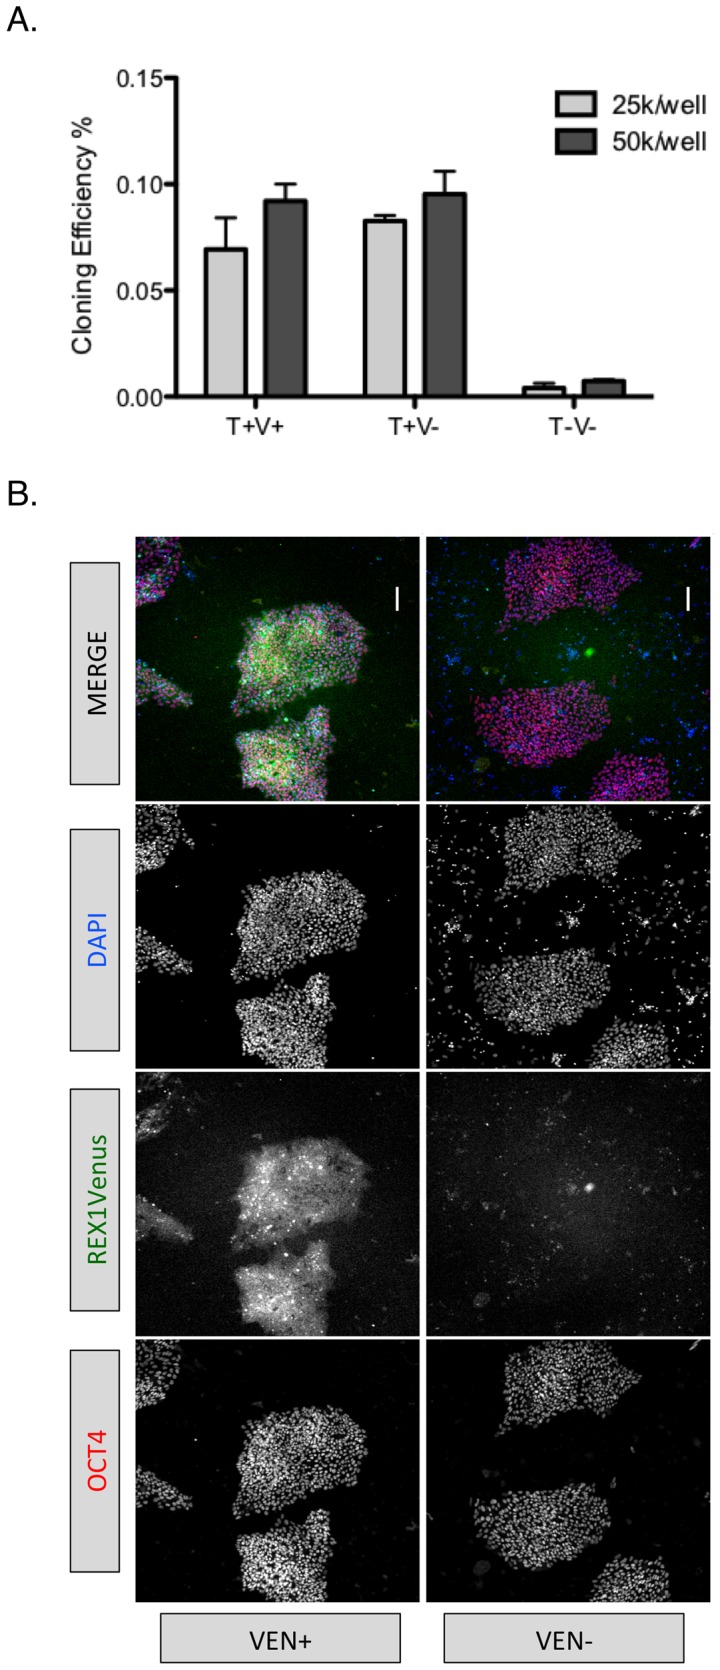
A) CIC activity of FACS purified TRA+VEN+ (T+V+), TRA+VEN− (T+V−) and TRA−VEN− (T−V−) populations isolated from undifferentiated cultures of H1 REX1Ven/w cells. B) OCT4 immunocytochemistry and REX1Venus expression in FACS isolated REX1Venus positive (VEN+) or negative (VEN−) populations after 12 days culture. Scale = 120 microns.