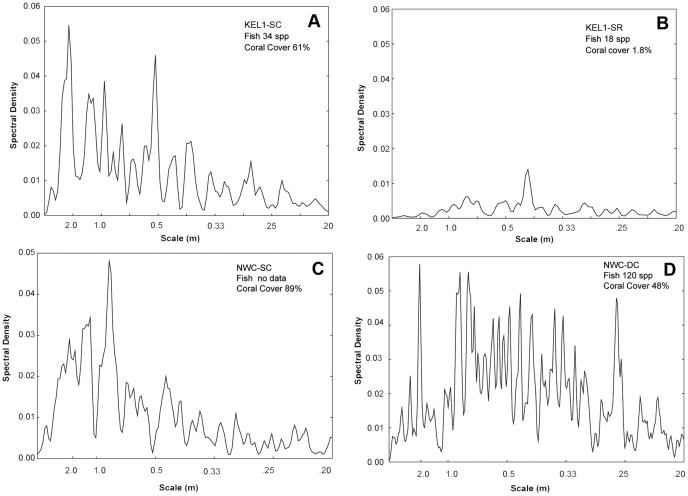
Figure 5. Scale of structural complexity revealed by Fast Fourier analysis of DRR.
Spectral Density plots of DDR transects at Kelor Point (3–5 m) for a rich coral transect at KEL1-SC (A) and adjacent rubble site at KEL1-SR (B). Periodograms C and D characterize transects at Northwest Corner for rich coral cover in shallow (NWC-SC, 3 m) and deeper (NWC-DC, 9 m).

