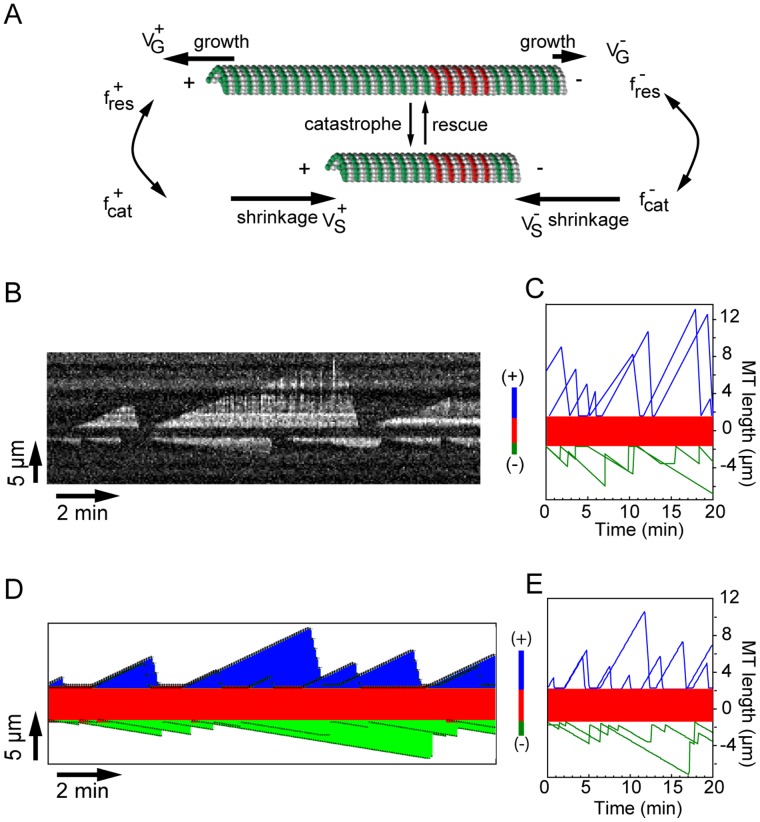
Figure 3. Modelisation of the dynamics of individual MTs.
(A). Scheme of a dynamic MT (green) elongating from a stable MT seed (red). The different parameters of MT dynamics are (i) growth rates at (+/−) ends (VG +/VG −), (ii) shrinkage rates (Vs +/Vs −), (iii) catastrophe/rescue frequencies at MT (+) ends (fres +/fcat +) and (−) ends (fcat −/fres −). (B). Experimental kymograph of an individual MT fluctuating away from the seed (dark band at the kymograph center). Scheme on right of the kymograph shows the orientation of MT ends. (C). History plots of two individual MTs observed by TIRFm. Blue and green traces correspond respectively to MT (+) and (−) ends. (D). Kymograph of two simulated independent MTs elongating from a seed (red). MT (+) ends are in blue; MT (−) ends are in green. (E). Corresponding fluctuation plots over time (same code color as in C).

