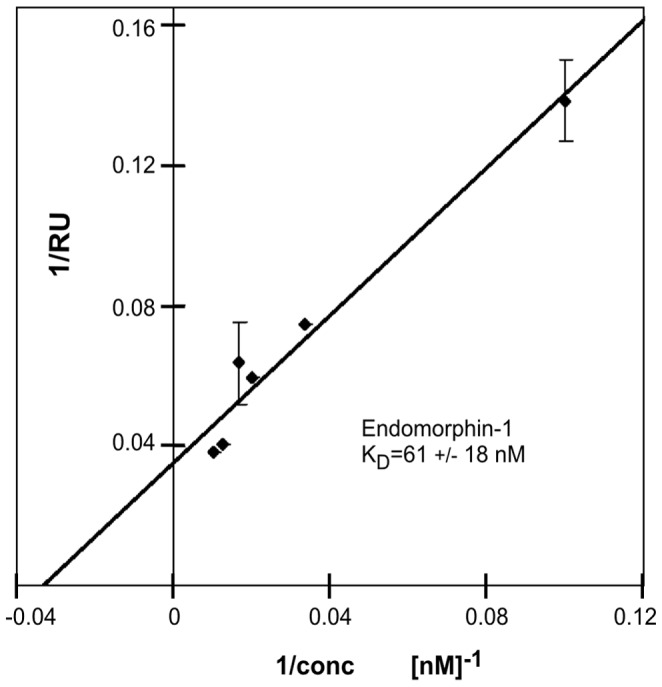
Figure 8. Interaction of OPRM with Endomorphin-1 by Surface Plasmon Resonance (SPR).

SPR shows the apparent association increases in RU response with the addition of EM-1 at 25°C. The binding constant (KD) of EM-1 to OPRM was obtained from (Rmax-R)*C/R, where C is concentration of EM-1, total concentration of OPRM is proportional to maximum binding capacity Rmax, Concentration of complex is measured directly as Response Unit in R. A KD of 60.9±18.1 nM for EM-1 was determined by fitting the data with a 1∶1 interaction model. Error bars represent values of two duplicates.
