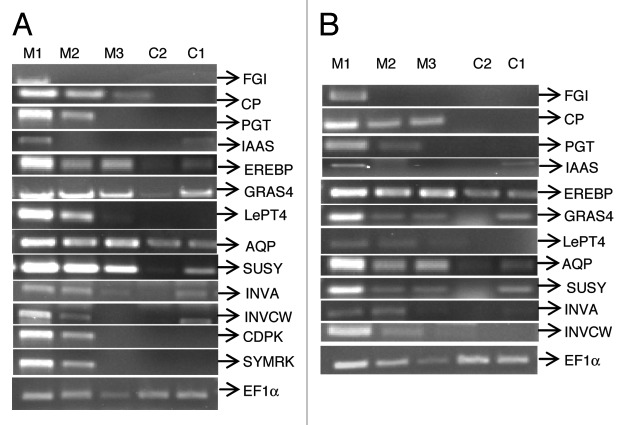
Figure 2. Expression of AM induced genes in Solanum lycopersicum cv 76R (A) and its colonization deficient mutant (rmc) (B), 52 dpi with Glomus fasciculatum. Transcript abundance was analyzed using semiquantitative RT-PCR. M1, M2 and M3 represent 0, 5 and 10-fold dilutions of the cDNA prepared from AM roots and C1 and C2 represent 0 and 5-fold dilution of the cDNA prepared from non-colonized roots. Constitutively expressed EF 1α was used as a loading control for comparing expression levels. The genes studied were: FGI (Fungal endoglucanase inhibitor); CP (Cysteine Protease); PGT (Phenolic glycosyltransferase); IAAS (IAA amido synthetase); EREBP (Ethylene response element binding protein); GRAS4 (GRAS family transcription factor); LePT4 (Low affinity phosphate Transporter); AQP (Aquaporin); SUSY (Sucrose synthase); INVA (Vacuolar Invertase); INVCW (Cell wall Invertase Lin6); CDPK (Calcium dependent protein kinase); SYMRK (Symbiosis receptor-like kinase).

An official website of the United States government
Here's how you know
Official websites use .gov
A
.gov website belongs to an official
government organization in the United States.
Secure .gov websites use HTTPS
A lock (
) or https:// means you've safely
connected to the .gov website. Share sensitive
information only on official, secure websites.
