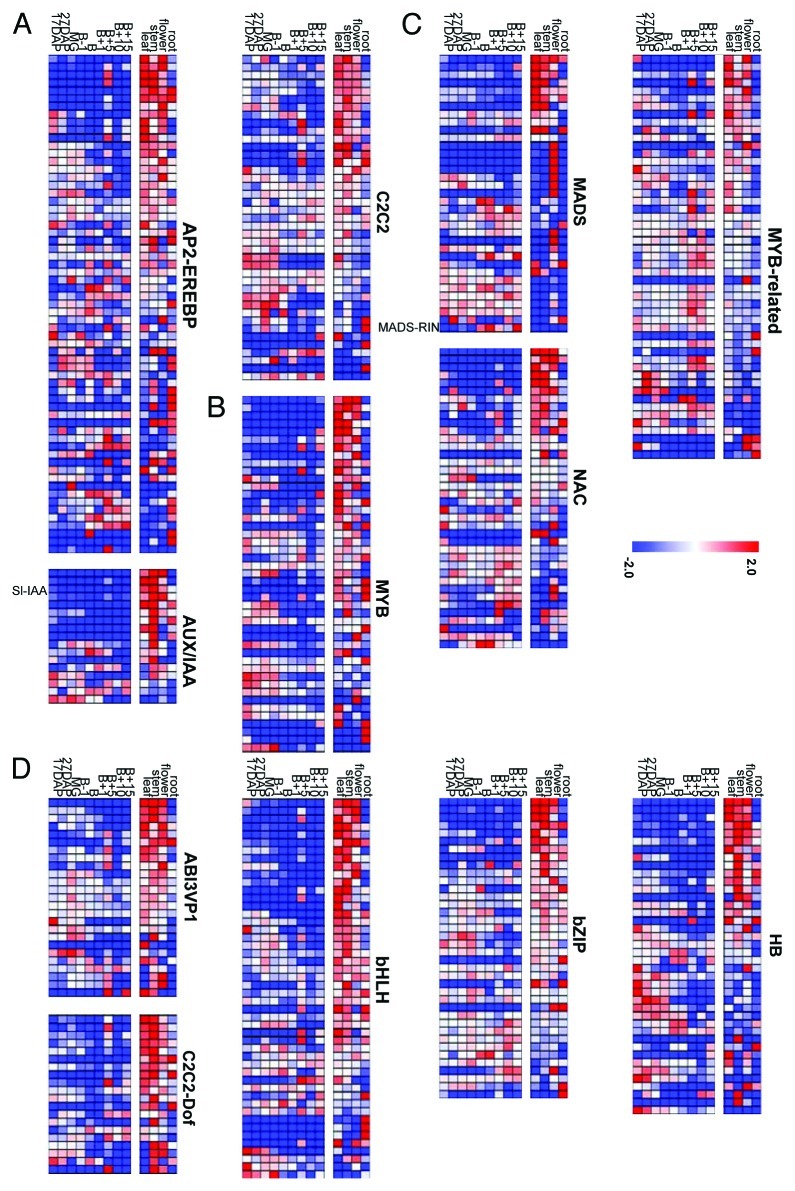
Figure 1. Transcription Factors showing a significant difference between fruit and non-fruit tissue. A) early responding TFs, (B) early responding from early stages until the B+15 stage TFs and (C) late responding TFs during fruit ripening (Rohrmann et al., 2011), and (D) TF families expressing in non-fruit tissues. In total 12 TF gene families showed a significant difference in their expression in fruit and non-fruit tissue. Relative TF contents of fruits harvested from 17DAP until B+15 as well as four non-fruit tissues (leaf, stem, flower and root). TF contents are shown as I"I"CT relative to average expression in all studied tissues = 0. Value shows the median of three biological replicates. Changes are shown from -2CT (blue) up to 2CT (red) values. Value shows median of three biological replicates. B, breaker stage; B+5, 5d after breaker; B+10, 10d after breaker; B+15, 15d after breaker; DAP, days after pollination; MG, mature green.

An official website of the United States government
Here's how you know
Official websites use .gov
A
.gov website belongs to an official
government organization in the United States.
Secure .gov websites use HTTPS
A lock (
) or https:// means you've safely
connected to the .gov website. Share sensitive
information only on official, secure websites.
