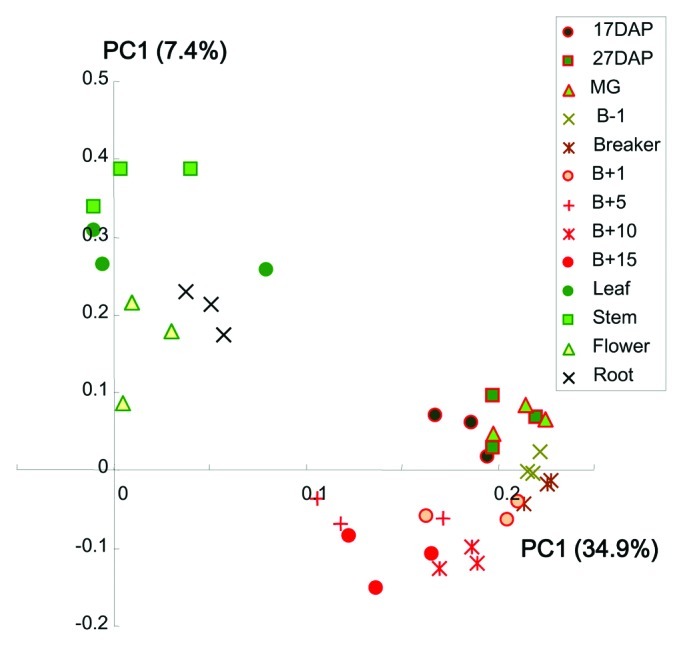
Figure 2. Principal component analysis of qRT-PCR expression profiles between different tomato tissues and fruit developmental stages.PCA score scatter plot of qRT-PCR expression profiles of 13 different tissues and fruits stages with three biological replicates. B, breaker stage; B+5, 5d after breaker; B+10, 10d after breaker; B+15, 15d after breaker; DAP, days after pollination; MG, mature green.
