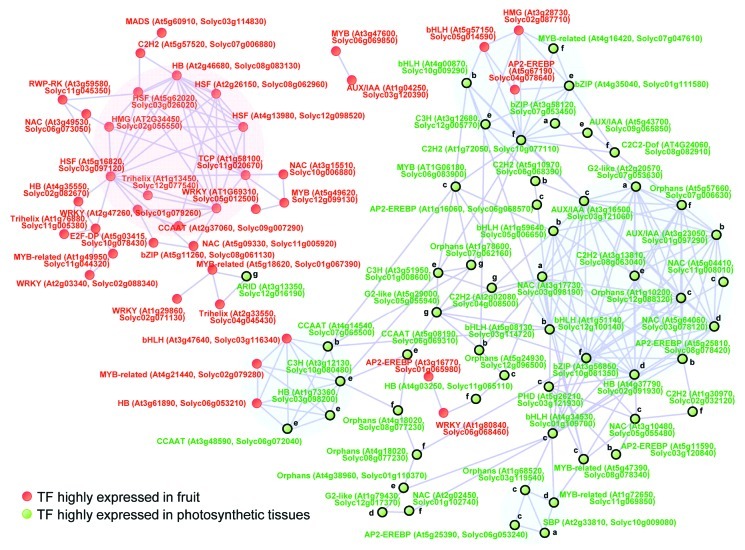
Figure 5. Network interaction of TF expressions with cross species comparison of tomato and Arabidopsis. Gene expression profile of tomato ripening stages,20 tomato tissues (in this study), Arabidopsis18 were combined based on the best BLAST hit gene (SOL Genome Network, SGN, http://solgenomics.net/). In total 91 TF genes were found in the correlation network with coefficient value (r > 0.75). Correlation network was determined using Pearson's correlation. Nodes; green indicates photosynthesis related TFs, red indicates TF genes highly expressed in fruit developmental stages. a)-h) indicates classification by K-mean clustering described in Figure 4.

An official website of the United States government
Here's how you know
Official websites use .gov
A
.gov website belongs to an official
government organization in the United States.
Secure .gov websites use HTTPS
A lock (
) or https:// means you've safely
connected to the .gov website. Share sensitive
information only on official, secure websites.
