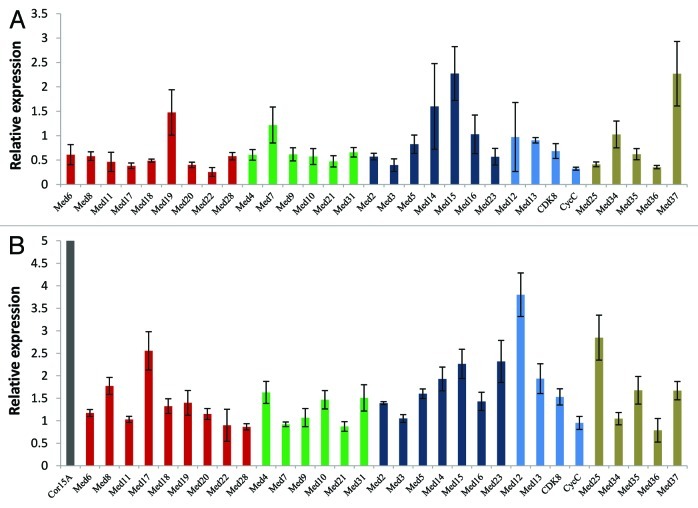
Figure 5. Quantitative real-time RT-PCR analysis showing change in the transcript abundance of Med genes in Arabidopsis seedlings (A) grown in complete darkness or (B) treated with high light. Cor15A were used as positive control for high light stress treatment. The relative expression level represents fold change to control seedlings. Mean values from three independent experiments are shown. Error bars represent standard deviation. Red, green, dark blue and blue bars represent AtMed genes coding for subunits of Head, Middle, Tail and Kinase modules, respectively. Subunits, whose positions are not known, are shown in tan color.

An official website of the United States government
Here's how you know
Official websites use .gov
A
.gov website belongs to an official
government organization in the United States.
Secure .gov websites use HTTPS
A lock (
) or https:// means you've safely
connected to the .gov website. Share sensitive
information only on official, secure websites.
