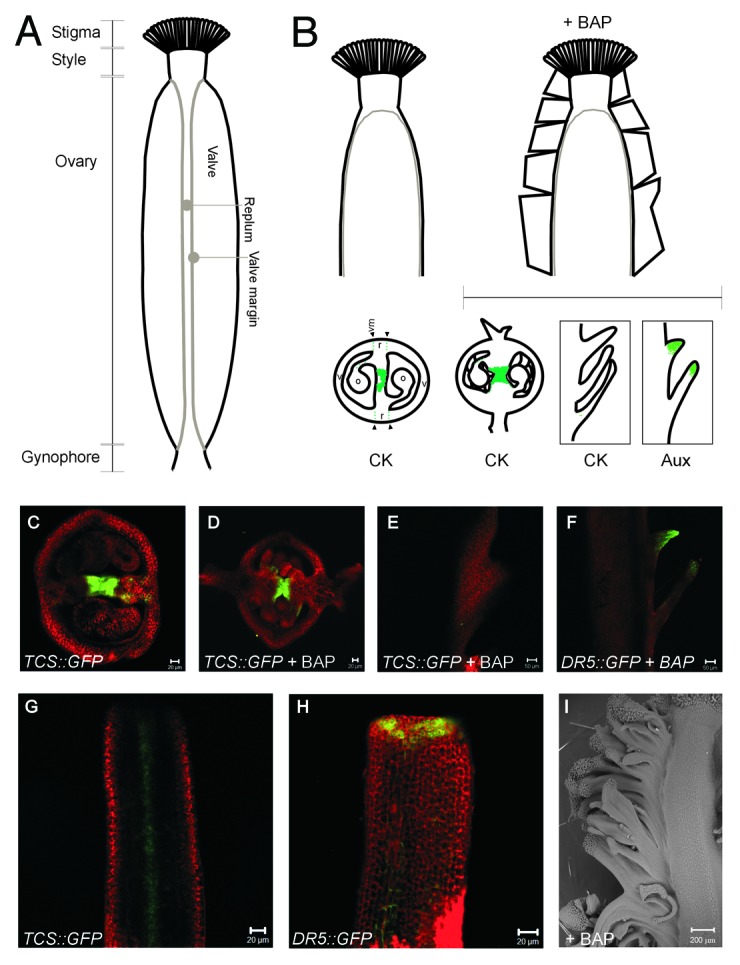
Figure 1. Cytokinin and auxin response in gynoecia and fruits. A) Parts of the Arabidopsis gynoecium. B) Drawings of the side view of a control (left) and BAP sprayed (right) gynoecium. The schemes below represent the localization of the cytokinin (CK) or auxin (Aux) response as indicated. Single plane confocal photographs showing the response to each hormone are also shown: C) transverse section of control TCS::GFP, D) and E) transverse (D) and longitudinal optical (E) sections of BAP sprayed TCS::GFP, F) longitudinal optical section of sprayed DR5rev::GFP. G) and H) Longitudinal confocal photographs (single plane) of young TCS::GFP (G) or DR5rev::GFP (H) gynoecia. I) Scanning electron micrograph of a BAP-sprayed gynoecium, where the ectopic tissue can be observed at the right side. v, valve; o, ovule; r, replum; vm, valve margin.
