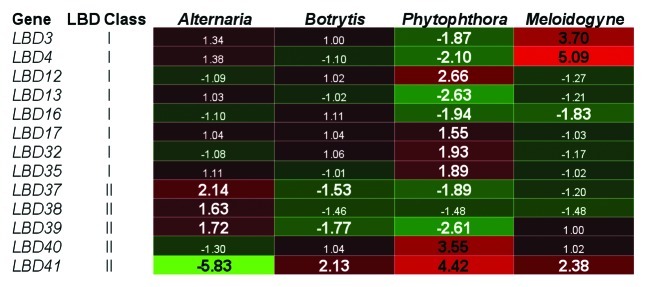
Figure 1.Expression profiles of LBD genes responsive to selected leaf or root pathogens. Public array data examined through GENEVESTIGATOR20 is presented for eight class I and five class II LBD genes in leaf tissue in response to the leaf infecting necrotrophic fungal pathogens Alternaria brassicicola or Botrytis cinerea, or in root tissue in response to the root pathogen Phytophthora parasitica (oomycete) or to the root-knot nematode Meloidogyne incognita. Shown are fold changes relative to controls with those > 1.5-fold highlighted in bold font. For data sets with multiple sampled time-points, time-points with the greatest fold changes were selected. This figure was generated using the HeatMapper tool from The Bio-Array Resource for Plant Biology (http://bar.utoronto.ca/) with green and red representing repressed or induced gene expression, respectively.
