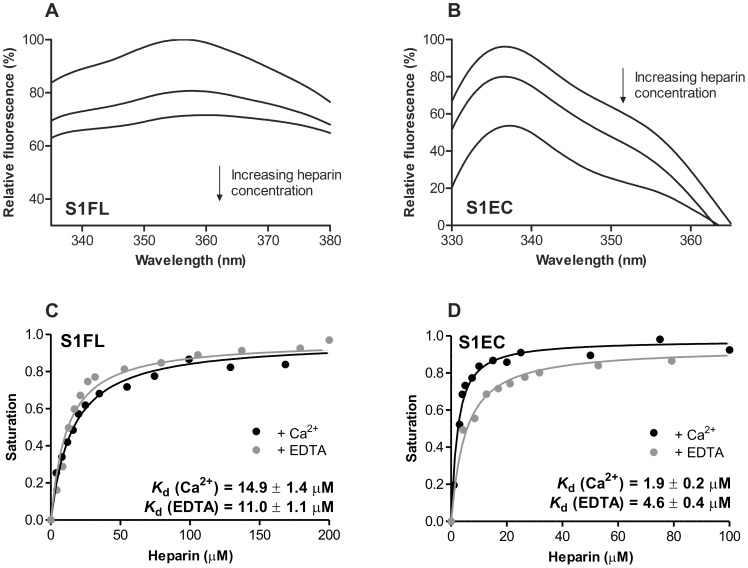
Figure 4. Intrinsic tryptophan fluorescence of SMOC-1 and S1EC in the presence of heparin.
(A, B) Changes in intrinsic fluorescence emission spectra of SMOC-1 and S1EC, respectively, in the presence of various concentrations of heparin. Proteins (5 µM) were incubated with increasing amounts of heparin (0–200 µM, top line to bottom line, respectively). An excitation wavelength of 295 nm was used and spectra recorded from 300 to 500 nm. The observed relative changes in intrinsic fluorescence were plotted as a function of heparin concentration and transformed to degree of saturation. (C, D) Plots of fluorescence intensity versus heparin concentration. The solid black lines represent the best-fit curves calculated with Equation 2. Calcium binding of SMOC-1 or S1EC to heparin was also assessed in the presence of 5 mM EDTA. Best-fit curves are shown as grey solid lines. All calculated K d values are given in the plots. The analysis was performed with GraphPad Prism 5.0 Software.

