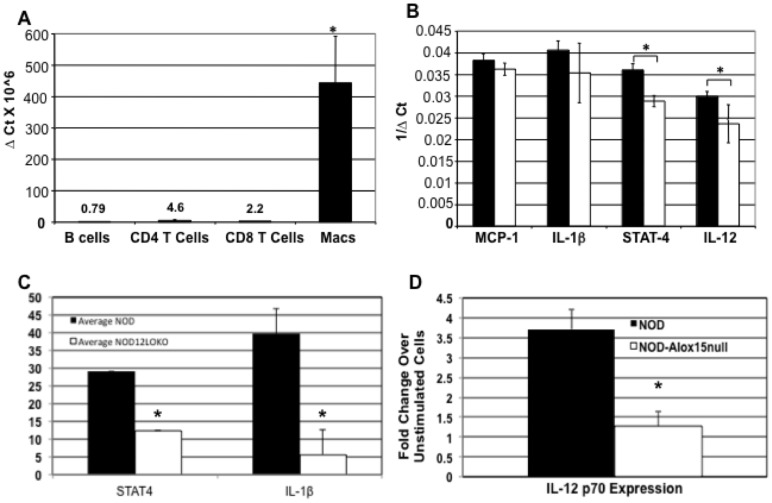
Figure 1. Expression of Macrophage 12/15-LO and downstream mediators.
A) 12/15-LO expression of NOD mice macrophages versus lymphocytes. Data are shown as ΔCt X106. B) Macrophage mRNA expression of downstream effectors of the 12/15-LO pathway. Thioglycollate-induced peritoneal macrophages of NOD (n = 5) and NOD-Alox15null (n = 3) mice were tested for mRNA expression of proinflammatory cytokines and STAT4 by qRT-PCR using Taqman probes. Data are shown as 1/ΔCt. Data represent 2 experiments with n = 4 mice per group. C) Protein levels for total STAT4 and IL-1β in thioglycollate-induced macrophages were measured in duplicate by ELISA (NOD, n = 5; NOD-Alox15null, n = 4). D) IL-12p70 levels in bone marrow macrophages were determined by intracellular flow cytometry (n = 3 for each strain. *p<0.05. Filled bars represent NOD samples. Filled bars represent NOD mice and open bars represent NOD-Alox15null mice.

