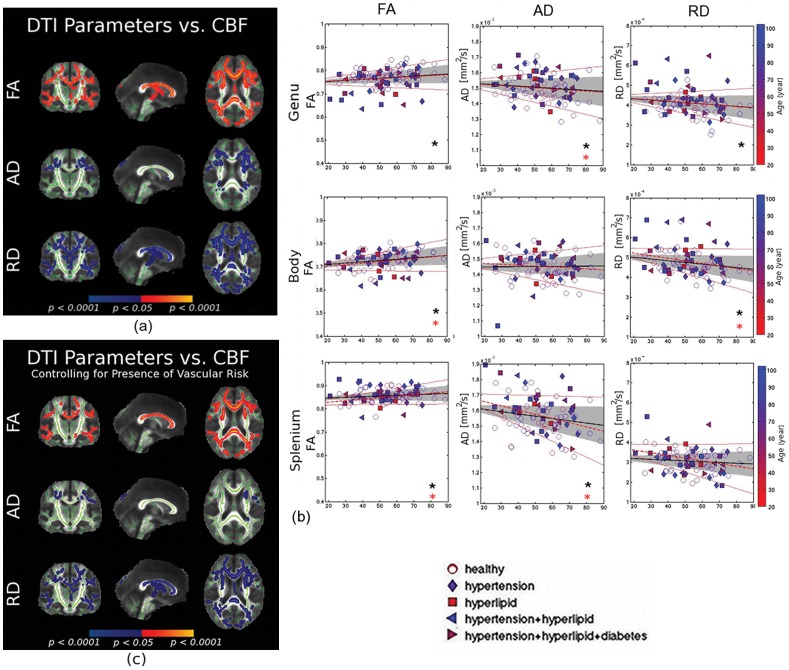
Figure 2. Correlation between DTI parameters and mean cortical CBF, without controlling for age.
(a) The white-matter TBSS skeleton is shown in green. Cortical CBF was positively associated with white matter FA (shown in red-yellow), and negatively associated with AD and RD (shown in blue). Also, the association between DTI parameters and CBF was more evenly distributed throughout the callosum, also confirmed in the regional data plots in (b). (b) The relationship between mean cortical CBF and DTI measures in the corpus callosum, with the 95% confidence interval outlined by the shaded region. Each symbol represents one subject, colour-coded for age, with different symbols representing subjects with different vascular risk factors. The relationship between white-matter microstructure and CBF was also plotted for the risk-free subjects alone (dashed red lines), with the 95% confidence interval delimited by solid red lines. These fits show statistical similarity with the previous fits, evident from the overlapping intervals of confidence delimited by solid red lines. Significant CBF-correlations are indicated by asterisks (black for all subjects, red for risk-free subjects only). (c) Controlling for the presence of vascular risk resulted in limited changes in the observed associations between white-matter integrity and cortical CBF.

