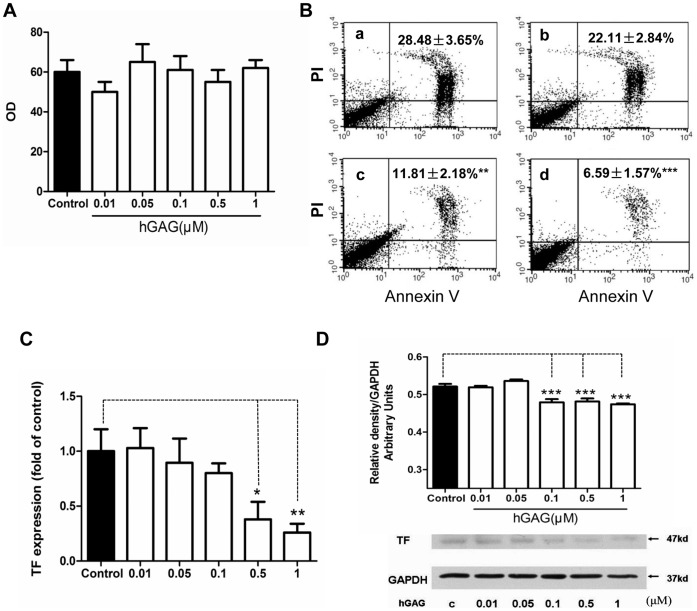
Figure 3. Effects of hGAG on Ca2+ efflux, phosphatidylserine (PS) exposure and TF expression.
(A) hGAG treatment shows no effect on Ca2+ efflux. B16F10 tumor cells were treated with hGAG (0–1 µM) for 24 h/37°C and fluo-4AM was used to measure the level of Ca2+. (B) hGAG treatment decreases the extent of phosphatidylserine exposure in the B16F10 tumor cells. Cells were treated with hGAG at the indicated concentration (a: medium only; b: hGAG 0.01 µM; c: hGAG 0.1 µM; d: hGAG 1.0 µM) and stained with Annexin V-FITC and PI (nucleus). Note that with the increase of hGAG concentration, the percentage of cells displaying Annexin-FITC signals was significantly reduced compared to the cells treated with medium only (a). (C) hGAG treatment inhibits TF transcription in the B16F10 tumor cells. Relative mRNA levels were assayed by quantitative real-time PCR and expressed after normalized to the control samples. (D) hGAG treatment reduces TF protein expression. B16F10 tumor cells were treated with hGAG at the indicated concentration for 24 h and the level of TF was analyzed by western blotting. GAPDH was used as a loading control. Data are represented as mean ± S.E. *p<0.05, **p<0.01, ***p<0.001.

