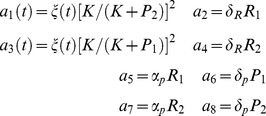
Table 6. Toggle switch model.

|

|
The bistable model of gene expression in [86]: the stoichiometry matrix (rows in order  ,
,  ,
,  ,
,  ) and the propensity functions.

|

|
The bistable model of gene expression in [86]: the stoichiometry matrix (rows in order  ,
,  ,
,  ,
,  ) and the propensity functions.