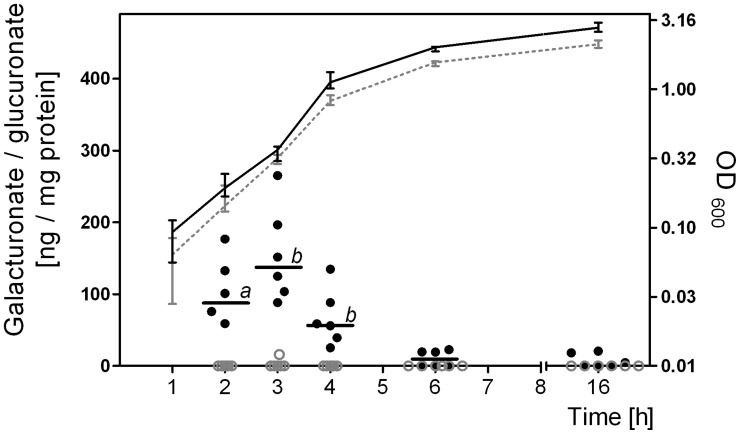
Figure 4. Formation of intracellular galacturonate and glucuronate during growth of E. coli on lactose.
Intracellular galacturonate and glucuronate concentration was monitored during growth of E. coli MG1655 on M9 minimal medium containing 25 mM lactose or 50 mM glucose under aerobic conditions. Cell densities were determined at 600 nm. OD600 on glucose medium (dashed gray line), and on lactose medium (black line); intracellular galacturonate concentration on glucose medium (gray dots), and on lactose medium (black dots). Data are expressed as medians (n = 6). The Mann-Whitney test was applied. a, P<0.05; b, P<0.01.

