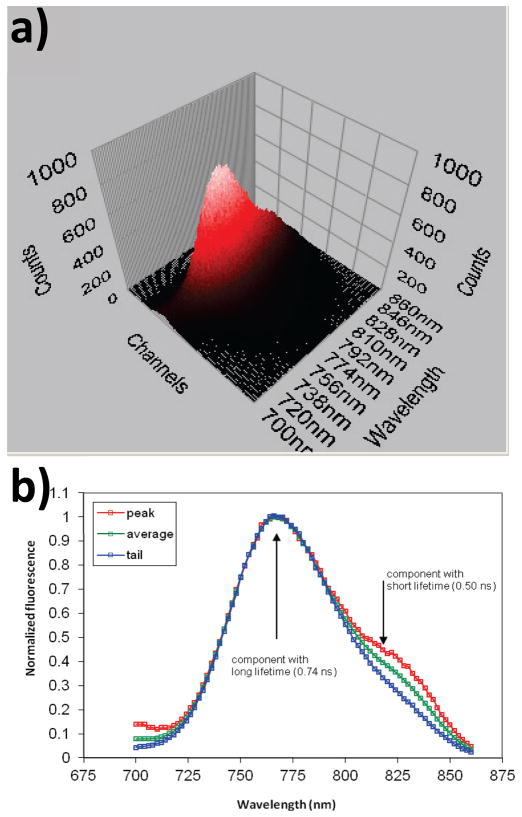
Figure 4.
(a) 3D TRES spectrum of dye 3 in methanol solution at pH=4.0, the arrows show the directions of slices. Red arrow – at the peak of the decay (short lived component), blue – at the tail of the decay (long lived component). (b) The 2D slices obtained are normalized and show that the long lifetime component does not have a shoulder, indicating that it belongs to two distinct fluorophores in solution, excitation 700 nm.

