
Figure 1.
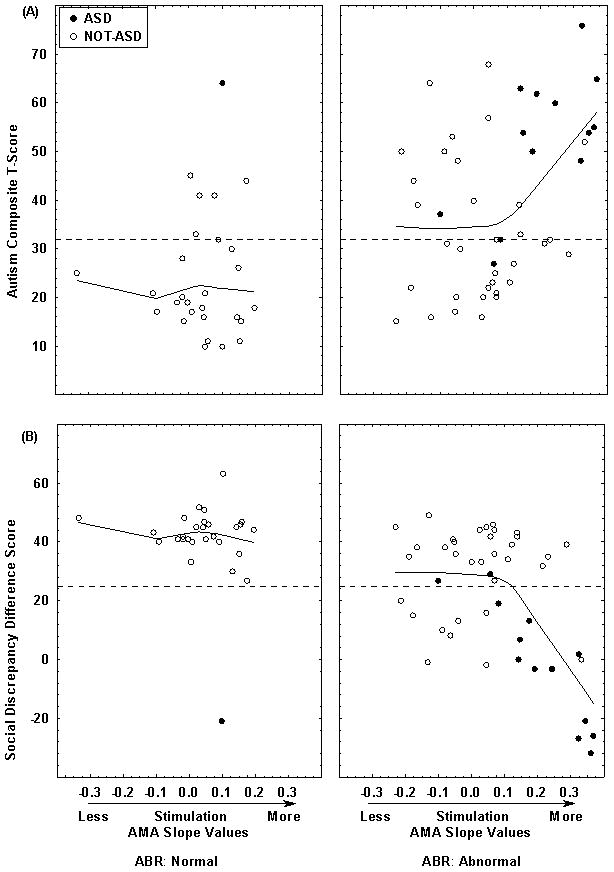
Shown are the PDDBI Autism Composite T-score (A) and Social Discrepancy difference score (B) versus individual AMA slope values at four months of age and ABR group. Filled circles are ASD cases and open circles are Not-ASD cases. Dotted lines along the ordinates indicate the cut-off scores that best discriminate ASD from non-ASD cases. Fitted curves are based on a LOWESS function with a stiffness of 0.9. Curves for the Abnormal ABR group show a discontinuity near an AMA Slope of 0.1.