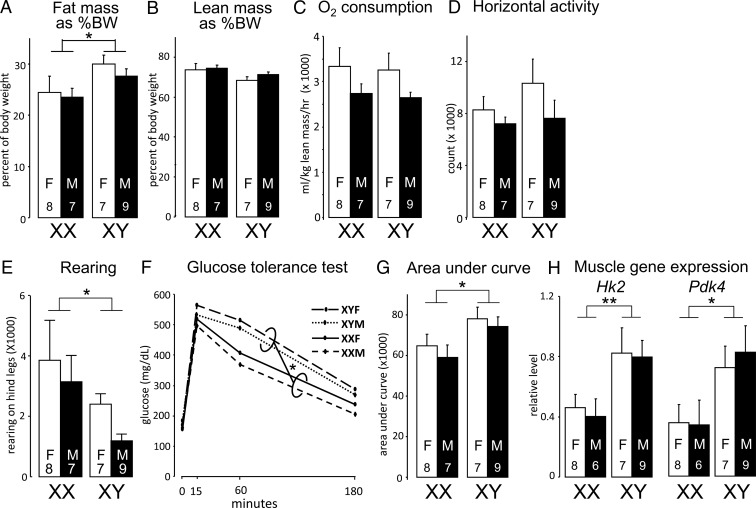
Figure 3.
Body composition of FCG (cross A) mice eating a chow diet 9 months after GDX. A, XY mice had more body fat relative to body weight than XX mice (F(1,27) = 5.21, P < .03, 2-way ANOVA). B, Groups did not differ in lean mass as percentage of body weight (BW). C, O2 consumption did not differ among groups. D, Groups did not differ in activity in the horizontal plane. E, XX mice had greater rearing activity, relative to XY mice, as detected by breaking a laser beam in the vertical axis of the cage. F and G, Compared to XX mice, XY mice showed similar increase in blood glucose levels in response to injection of glucose, but impaired glucose clearance. H, Area under the curve in G indicates slower clearance of glucose in XY relative to XX mice. I, XY mice had higher expression levels of hexokinase 2 (Hk2) and pyruvate dehydrogenase kinase 4 (Pdk4) mRNA in skeletal muscle. F, female; M, male. *P < .05, **P < .01.

