
Figure 5.
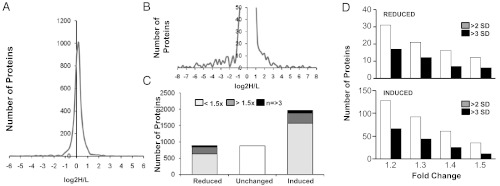
Quantitative mass spectrometry reveals changes in the follistatin-like 3 (FSTL3) knockout (KO) testis proteome. An overview of quantitative mass spectrometry results presented as a distribution curve of number of proteins versus the ratio of comparative protein expression between KO and wild-type (WT) (A). An enlargement of the curve in A showing the distribution of comparative expression of proteins from which candidate proteins were identified (B). Bar graph showing the number of proteins that are reduced, unchanged, and increased in KO compared with WT (C). Number of proteins reduced (top) or induced (bottom) in the testis of 16-mo-old FSTL3 KO mice by 1.2- to 1.5-fold over those of WT mice, as indicated. Number of proteins with mean fold expression > 2 SD and > 3 SD are shown (D).