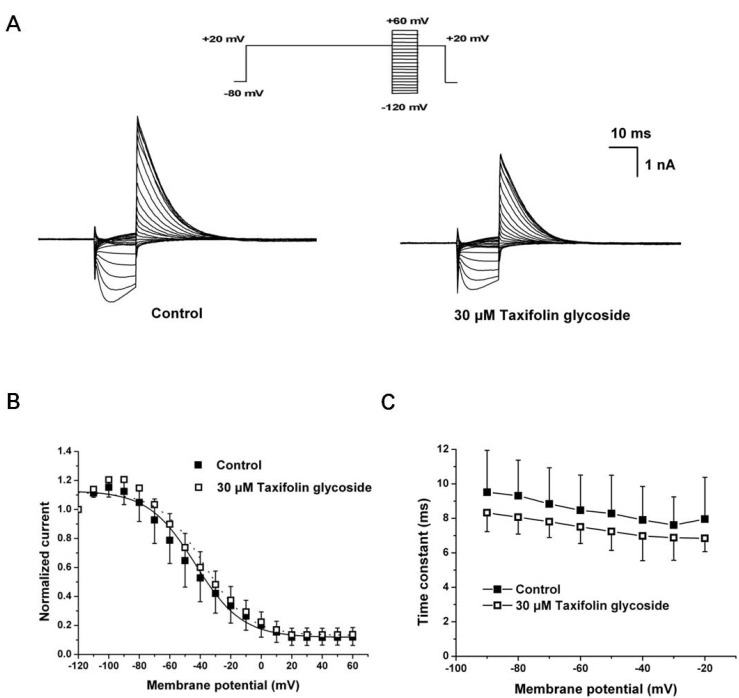
Fig. 3.
Effects of taxifolin glycoside on the steady-state inactivation of the hERG K+ channels. (A) Representative current traces for the steady-state inactivation in control and 30 µM taxifolin glycoside treated sample. (B) Normalized steady-state inactivation curves before and after exposure to 30 µM taxifolin glycoside. Smooth curves were fitted with the Boltzmann function (n=5). (C) The time constants of steady-state inactivation. The time constants obtained from a single exponential fit the decay of the outward current (n=5).

