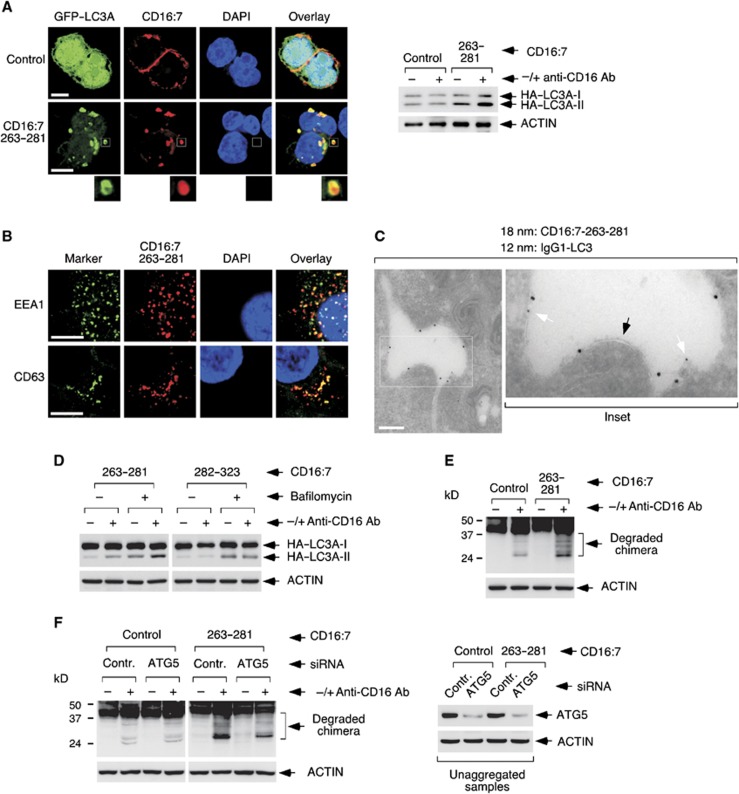
Figure 4.
The minimal active subdomain of TMEM59 promotes LC3 labelling and lysosomal degradation of its own vesicular compartment. (A) Endocytic vesicles containing aggregated CD16:7–263–281 become labelled with GFP–LC3. JAR cells were transfected with vectors expressing the indicated CD16:7 chimeras and GFP–LC3A, and subjected to anti-CD16 aggregation for 8 h before staining for the endocytosed chimera (red). Representative confocal pictures are shown. The inset highlights a vesicle where the peripheral GFP–LC3 staining is particularly distinguishable. The right panel displays control WBs showing that chimera aggregation for 8 h activates HA–LC3A conversion in JAR cells. (B) Colocalization of endocytosed CD16:7–263–281 with EEA1 and CD63. JAR cells were transfected with CD16:7–263–281 and subjected to aggregation before staining them for the endocytosed chimera (red) and EEA1 or CD63 (green; FITC-coupled primary antibodies), as indicated. Representative confocal pictures are shown. (C) Immunoelectron microscopy assay showing that endocytosed CD16:7–263–281 localizes to LC3-labelled, single-membrane vesicles. JAR cells were transfected with the CD16:7–263–281 chimera and a construct expressing human IgG1 fused to LC3A. Cells were subjected to anti-CD16 aggregation for 8 h and processed for immunoelectron microscopy. Thick gold signal (18 nm): aggregated, endocytosed chimera; thin gold signal (12 nm): IgG1–LC3. Arrows indicate single membrane (black) or IgG1–LC3A (white). Scale bar: 400 nm. (D) Lysosomal inhibition increases HA–LC3II levels promoted by CD16:7–263–281. 293 cells were transfected with the indicated chimera and HA–LC3A, and subjected to anti-CD16 aggregation in the absence or presence of bafilomycin (200 nM, added 4 h post aggregation) before lysing them for western blotting against the indicated molecules. (E) Aggregation of CD16:7–263–281 promotes its own degradation. 293 cells were transfected with the indicated constructs, aggregated and lysed for western blotting. Shown are overexposed anti-CD16 WBs. (F) Degradation of CD16:7–263–281 is inhibited by ATG5 depletion. 293 cells were transfected with the indicated siRNAs and subsequently with the shown CD16:7 constructs, aggregated and lysed for anti-CD16 western blotting (left panel). The right panel displays control WBs showing ATG5 depletion.
Source data for this figure is available on the online supplementary information page.

