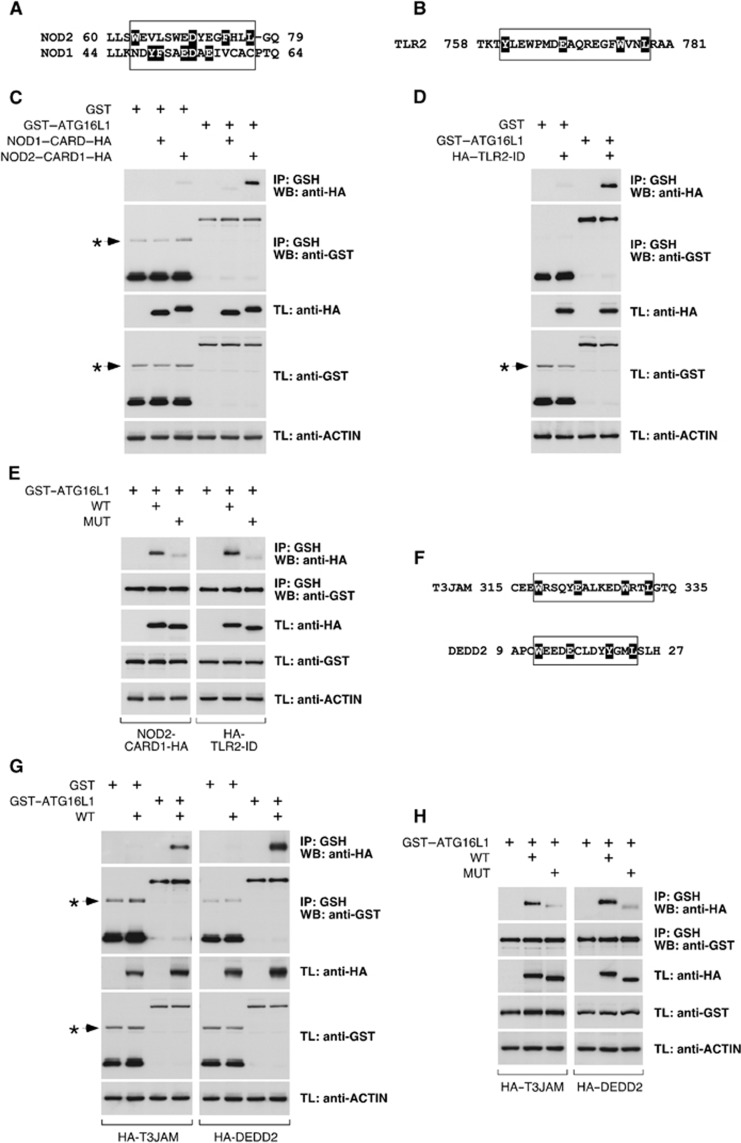
Figure 8.
The ATG16L1-binding motif is present with a similar ATG16L1-binding capacity in other molecules. (A) Alignment of the region that includes the motif in NOD2 with the same area in NOD1. The relevant amino-acid stretch is boxed. Individual amino-acid highlighting (black) in NOD2 indicates the residues identified by the Prosite algorithm as part of the motif. In NOD1, all residues that could be part of an eventual motif are highlighted to indicate that they form an incomplete motif. (B) Amino-acid region in TLR2 that includes the motif. Highlighting indicates residues identified by Prosite as part of the motif. (C, D, E, G, H) 293T cells were transfected with the indicated constructs, lysed and subjected to GST immunoprecipitation with agarose beads coupled to glutathione. Shown are WBs against the indicated molecules. (C) The N-terminal CARD of NOD2 (NOD2–CARD1–HA), but not the CARD of NOD1 (NOD1–CARD–HA), co-precipitates with GST–ATG16L1. (D) The ID of TLR2 (HA–TLR2–ID) co-precipitates with GST–ATG16L1. (E) Mutated versions (MUT) of NOD2–CARD1–HA and HA–TLR2–ID (as shown) do not co-precipitate with GST–ATG16L1. (F) Amino-acid sequences of T3JAM and DEDD2 including the motif. Residues identified by the Prosite algorithm are highlighted. (G) Wild-type (WT) versions of HA–T3JAM and HA–DEDD2 (as indicated) co-precipitate with GST–ATG16L1. (H) Mutated versions (MUT) of HA–T3JAM and HA–DEDD2 do not co-precipitate with GST–ATG16L1. Asterisks indicate irrelevant bands in C, D and G.
Source data for this figure is available on the online supplementary information page.

