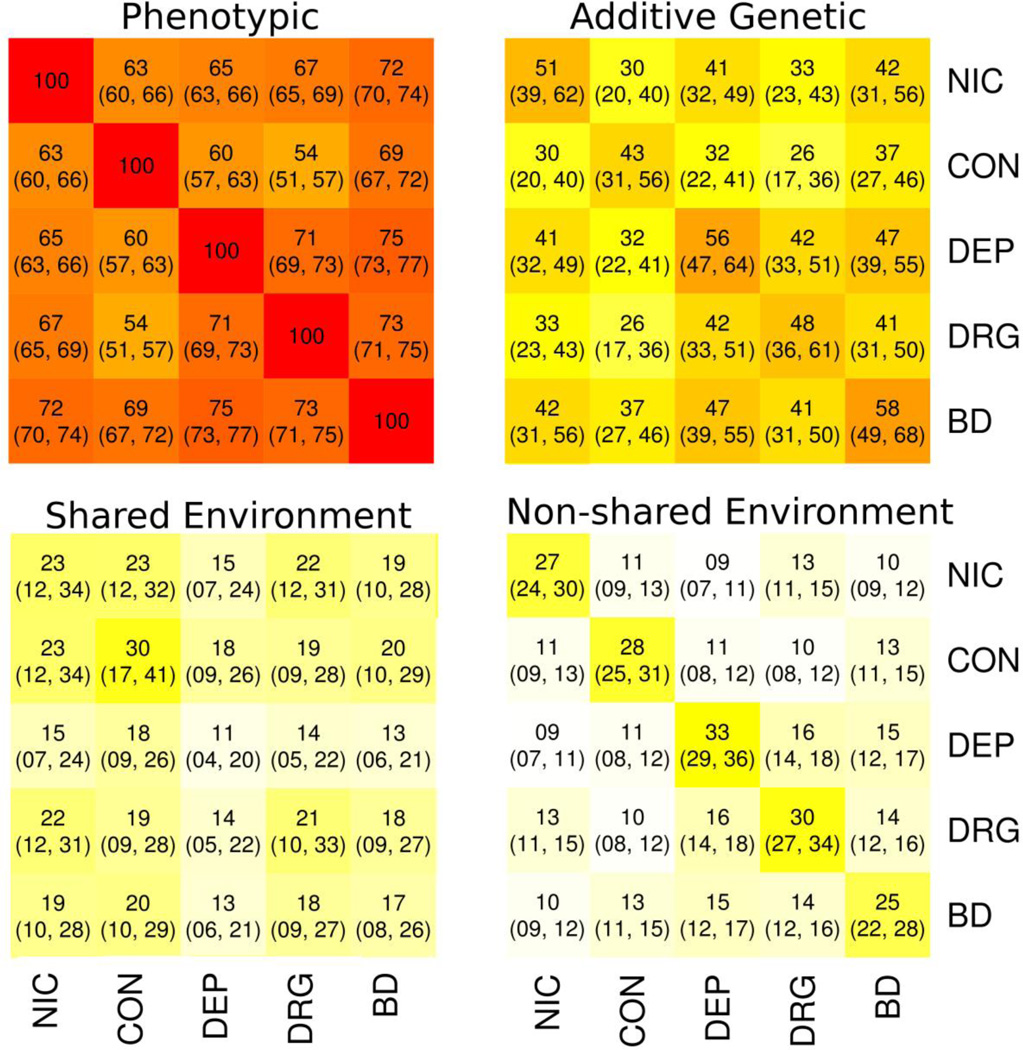
Figure 1.
Phenotypic correlations and biometric decomposition (leading decimals were removed). Shown here are the phenotypic correlation matrix, as well as the additive genetic, shared environmental, and non-shared environmental component matrices. In parentheses are the 95% maximum likelihood confidence intervals. The component matrices are scaled such that they sum elementwise to produce the full phenotypic matrix. All entries are significant at p < .05. Estimates are based solely on the twins, who have an average age of 17 years. NIC = Nicotine Use/Dependence; CON = Alcohol Consumption; DEP = Alcohol Dependence; DRG = Drug Use; BD = Behavioral Disinhibition.

