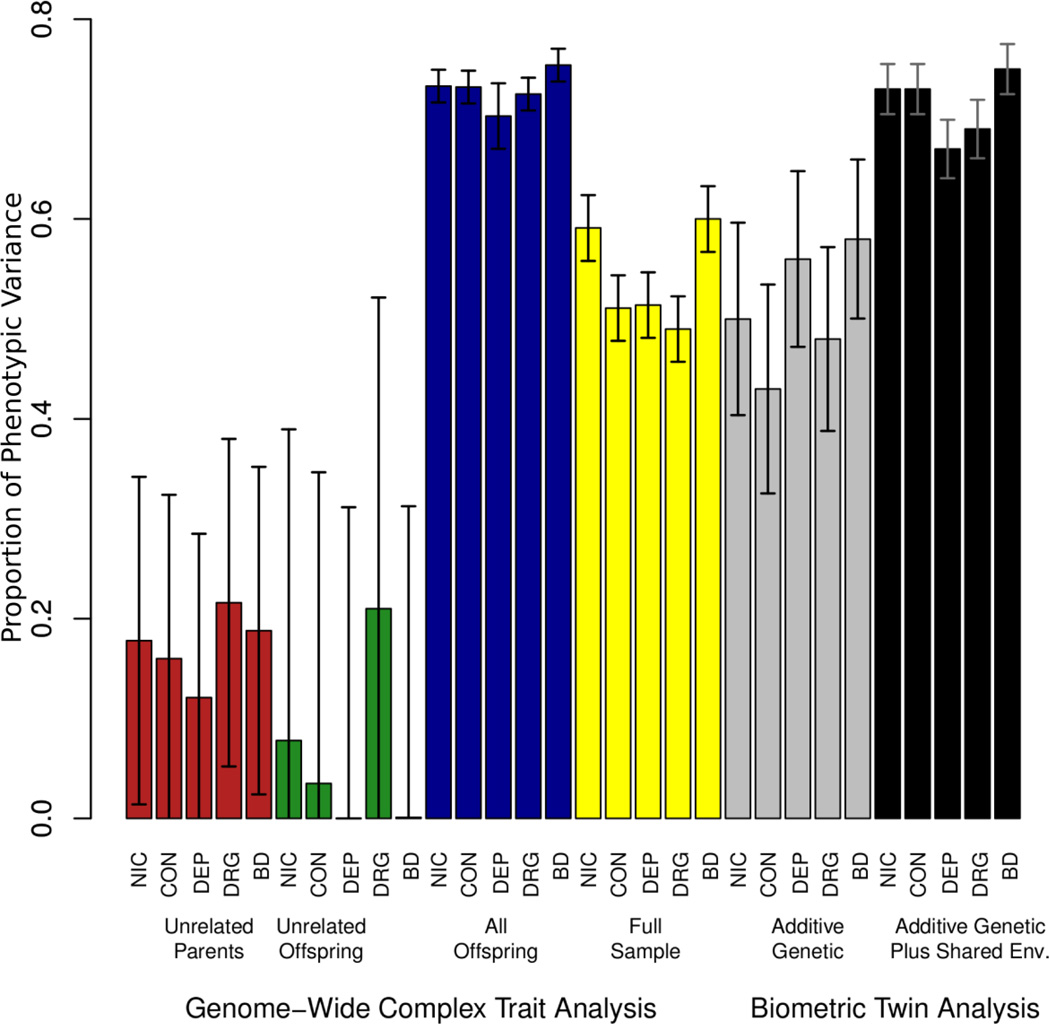
Figure 2.
GCTA results with Biometric Comparison. The GCTA results are provided for each phenotype in a variety of samples. In grey are the additive genetic heritability estimates from the biometric twin analysis (also in Figure 1). In black is the sum of the additive genetic and shared environment estimates from the biometric analysis (also in Figure 1). Unrelated individuals were defined as those having a genetic relatedness estimated by GCTA to be < .025 (more distantly related than third cousins). The samples are: A) All unrelated parents (N = 3542), B) unrelated youths (N = 1784), C) All youths (N = 3336), and D) the full sample (N = 7188). Error bars are 95% confidence intervals. NIC = Nicotine Use/Dependence; CON = Alcohol Consumption; DEP = Alcohol Dependence; DRG = Drug Use; BD = Behavioral Disinhibition.

