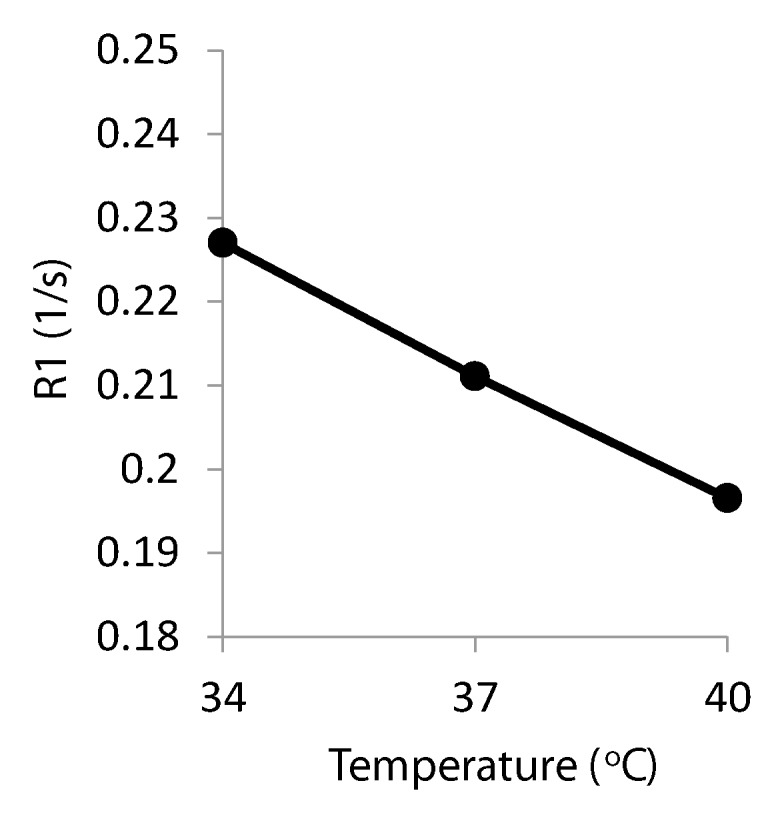
Figure 2b:

(a) Graph shows R1 versus Po2 of distilled water phantoms (▲, ■, ●) and ex vivo vitreous samples from a rabbit and baboon (△, □, ○) at three temperatures. Vertical error bars are standard deviation of R1 across six to nine repetitions. Horizontal error bars are standard deviation of two fiberoptic Po2 measurements made before and after MR imaging. (b) Graph shows R1 versus temperature from a single phantom (Po2 = 35.3 mm Hg).
