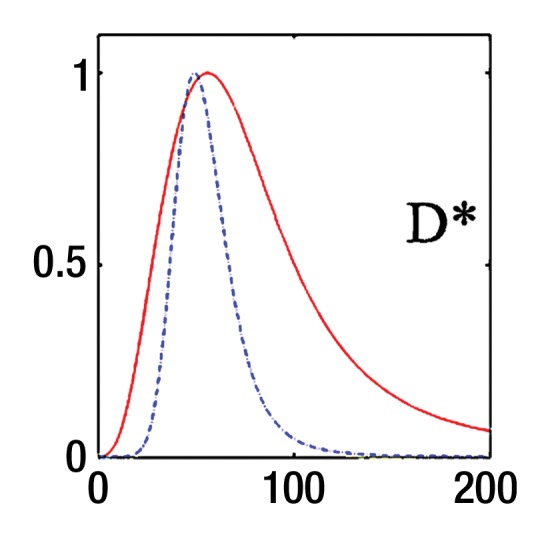
Figure 3d:

Bayesian analysis of IVIM DW imaging performed with the RT BP sequence in a 26-year-old healthy woman and a 55-year-old woman with HCV infection and METAVIR stage F3 fibrosis. (a) Graph shows logarithmic SI decay with 16 b values in the healthy volunteer (□) and the patient with HCV (○). For display purposes, data were normalized to an intensity of b = 0 sec/mm2. Solid (patient) and dashed (volunteer) lines are biexponential model curves obtained by using Bayesian-estimated IVIM parameters. Calculated values were as follows: for D, 0.81 × 10⁻³ mm2/sec and 1.06 × 10⁻³ mm2/sec for the patient with HCV and the healthy volunteer, respectively; for PF, 5.1% and 9.8%, respectively; and for D*, 50.5 × 10⁻³ mm2/sec and 49.4 × 10⁻³ mm2/sec, respectively. (b–d) PDF (measured in arbitrary units, normalized for display purposes) derived from Bayesian analysis for PF (b), D (c), and D* (d) for the same two subjects (patient, solid line; volunteer, dashed line). PF and D have narrow and distinct PDFs, which enable good differentiation between the two subjects. D* has overlapping PDFs, which means higher uncertainty for this parameter, and no ability to aid in discrimination between the healthy volunteer and the patient with HCV.
